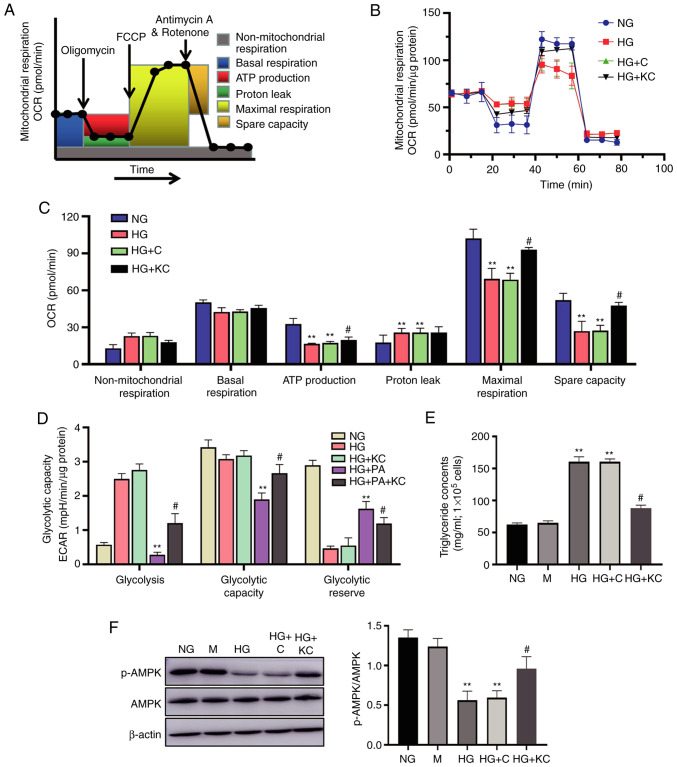
Figure 4.
Knockout of CD36 ameliorates metabolism reprogramming and lipid accumulation caused by HG in H9c2 cells. H9c2 cells were incubated with NG (5.6 mM, NG group), HG (30 mM, HG group), HG plus LV3 containing CD36 mutant (HG + KC group), HG plus PA (100 µM HG + PA group), or HG + PA plus LV3 containing CD36 mutant (HG + PA + KC group) for 72 h. (A) Protocol used in data collection and calculations for evaluating mitochondrial respiration. (B) Representative OCR curve. (C) Quantitative analysis of non-mitochondrial respiration, basal respiration, ATP production, proton leak, maximal respiration and spare respiratory capacity. (D) Quantitative analysis of glycolysis, glycolytic capacity and glycolytic reserve. All measured OCR and ECAR were normalized by total cellular protein. (E) The triglyceride content in the cells. (F) The p-AMPK and AMPK expression levels were analyzed by western blotting. Data are expressed as the mean ± SD. n=4. **P<0.01 vs. NG, #P<0.05 vs. HG. HG, high glucose; OCR, oxygen consumption rate; ECAR, extracellular acidification rate; p-, phosphorylated-.

