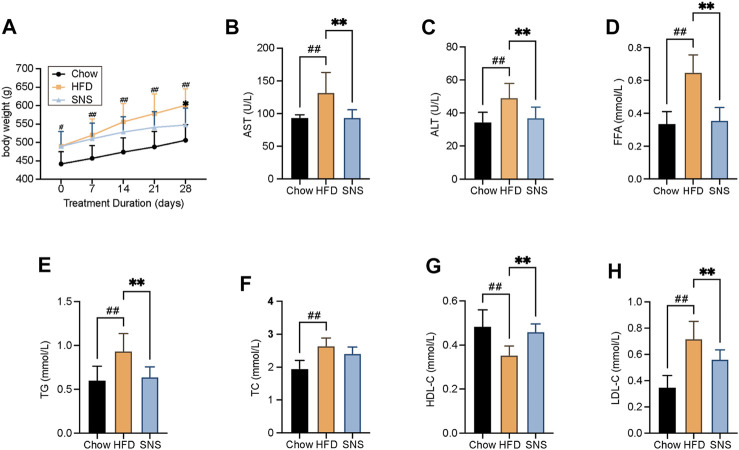
FIGURE 6.
Body weight and biochemical assays results after SNS treatment for rat NAFLD model. (A) Body weight measurement. (B) Serum aspartate aminotransferase (AST) levels. (C) Serum alanine aminotransferase (ALT) levels. (D) Serum free fatty acid (FFA) levels. (E) Serum total triglyceride (TG) levels. (F) Serum total cholesterol (TC) levels. (G) Serum high-density lipoprotein cholesterol (HDL-C) levels. (H) Serum low-density lipoprotein cholesterol (LDL-C) levels. Data are shown as mean ± SD (n = 9). # p < 0.05, ## p < 0.01, ### p < 0.001 when compared with chow group. *p < 0.05, **p < 0.01, ***p < 0.001 when compared with HFD group.

