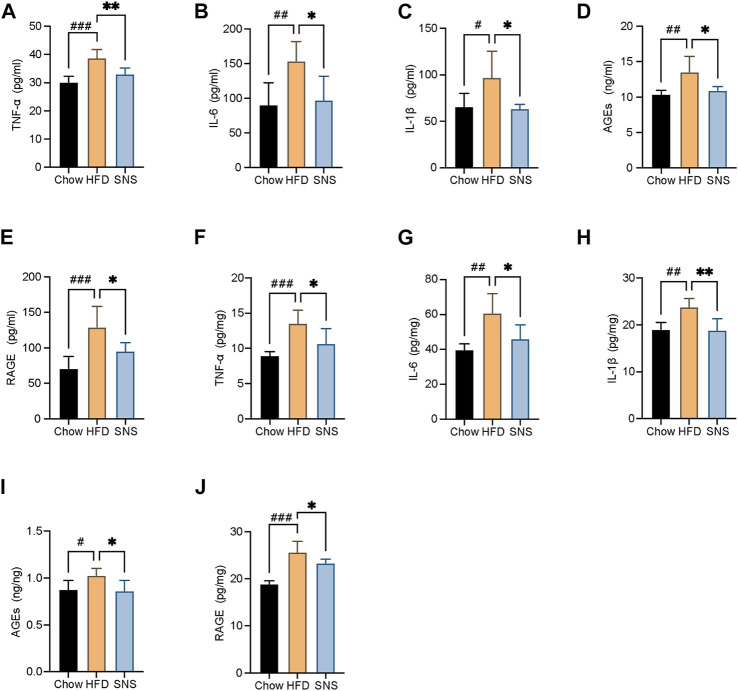
FIGURE 8.
SNS reduced liver pro-inflammatory cytokines, advanced glycation end-products (AGEs), and its receptor. (A) Serum levels of tumor necrosis factor alpha (TNFα). (B) Serum levels of interleukin 6 (IL6). (C) Serum levels of interleukin 1β (IL1β). (D) Serum levels of AGEs. (E) Serum levels of receptor for advanced glycation end-products (RAGE). (F) Liver levels of TNFα. (G) Liver levels of IL6. (H) Liver levels of IL1β. (I) Liver levels of AGEs. (J) Liver levels of receptor for RAGE. Data are shown as mean ± SD (n = 6). # p < 0.05, ## p < 0.01, ### p < 0.001 when compared with the Chow group, *p < 0.05, **p < 0.01, ***p < 0.001 when compared with the HFD group.

