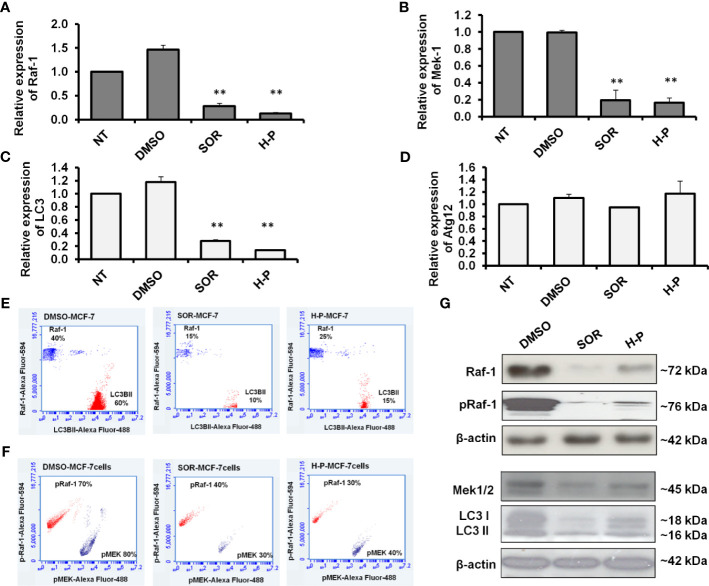
Figure 2.
Quantification of Raf-1, MEK1/2, LC3B, and ATG12 expression in SOR and H-P-treated cells. (A, B) Steady-state mRNA of Raf-1 and MEK1 indicated by the fold change in MCF-7 cells that were subjected to SOR or H-P extract in comparison with control-treated cells, n = 3. (C, D) Steady-state mRNA of autophagy-related LC3B and Atg12 indicated by the fold change in MCF-7 cells treated with SOR or H-P extract in comparison with control-treated cells, n = 3. Levels of GAPDH–mRNA were used as an internal control. Error bars indicate the SD of three independent experiments. (E) Quantification analysis of protein profile of both total Raf-1 and lipidated LC3B in treated MCF-7 cells indicated by flow cytometry and compared to DMSO-treated cells. (F) Quantification analysis of kinetic protein profile of pRaf-1 and pMEK in MCF-7 cells that were subjected to SOR or H-P indicated by flow cytometry and compared to DMSO-treated cells. (G) Immunoblotting investigation of total Raf-1, pRaf-1 Mek1/2, and LC3B proteins in pretreated MCF-7 cells using WesternBreeze Chromogenic Kit. β-Actin served as a loading control. Data are representative of three independent experiments. A Student’s two-tailed t-test was used for significance analysis of cycle threshold (Ct) values. **p ≤ 0.01.

