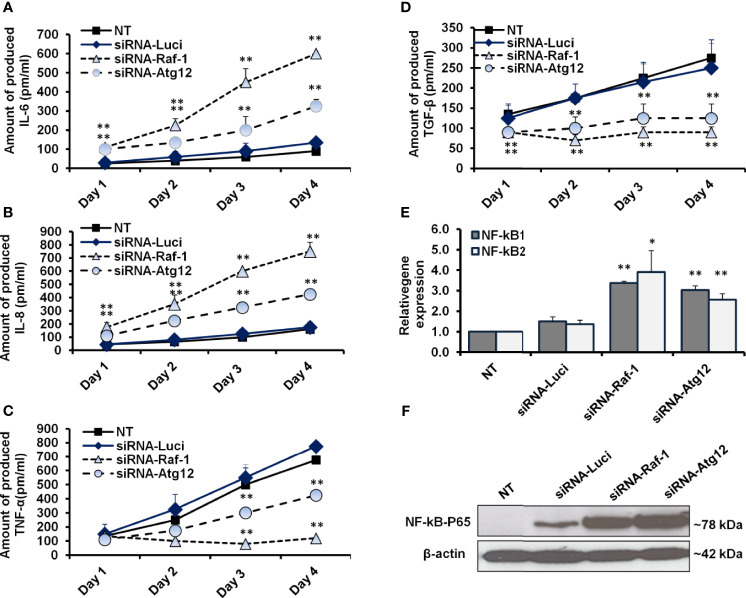
Figure 5.
Quantification analysis of proinflammatory cytokines and NF-kB effectors in siRNA-transfected cells. (A, B) The concentration of produced IL-6 and IL-8 (pm/ml) in the fluids media of MCF-7 that were transfected with siRNA against Raf-1 or Atg12 compared with the control-transfected cells, n = 4. (C, D) Level of produced TNF-α and TGF-β (pm/ml) from MCF-7 cells that were transfected with the indicated siRNAs compared with the control-transfected cells, n = 4. Error bars indicate the SD of four biological replicates. (E) Relative gene expression of NF-kB1 and NF-kB2 in transfected cells upon 48 h posttransfection in comparison with control-transfected cells that quantified by qRT-PCR. Error bars indicate the SD of three independent experiments. (F) Immunoblotting analysis of the conjugated NF-kB–P65 in transfected MCF-7 cells using WesternBreeze Chromogenic Kit. β-Actin served as a loading control. Data are representative of three independent experiments. A Student’s t-test analysis was performed. *p ≤ 0.05 and **p ≤ 0.01.

