
Figure 3.
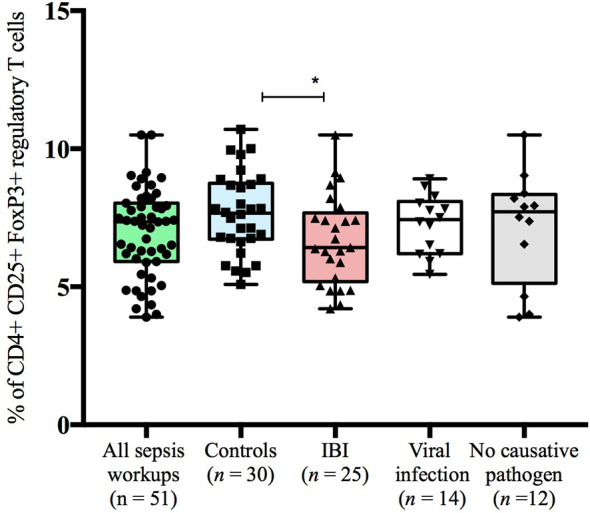
Frequencies of CD4+CD25+FoxP3+regulatory T cells stratified to subgroups of study cohort. Boxes are shown as median and IQR; *p-value was derived from Dunn’s multiple comparisons test (p < 0.05).
Official websites use .gov
A
.gov website belongs to an official
government organization in the United States.
Secure .gov websites use HTTPS
A lock (
) or https:// means you've safely
connected to the .gov website. Share sensitive
information only on official, secure websites.
Frequencies of CD4+CD25+FoxP3+regulatory T cells stratified to subgroups of study cohort. Boxes are shown as median and IQR; *p-value was derived from Dunn’s multiple comparisons test (p < 0.05).