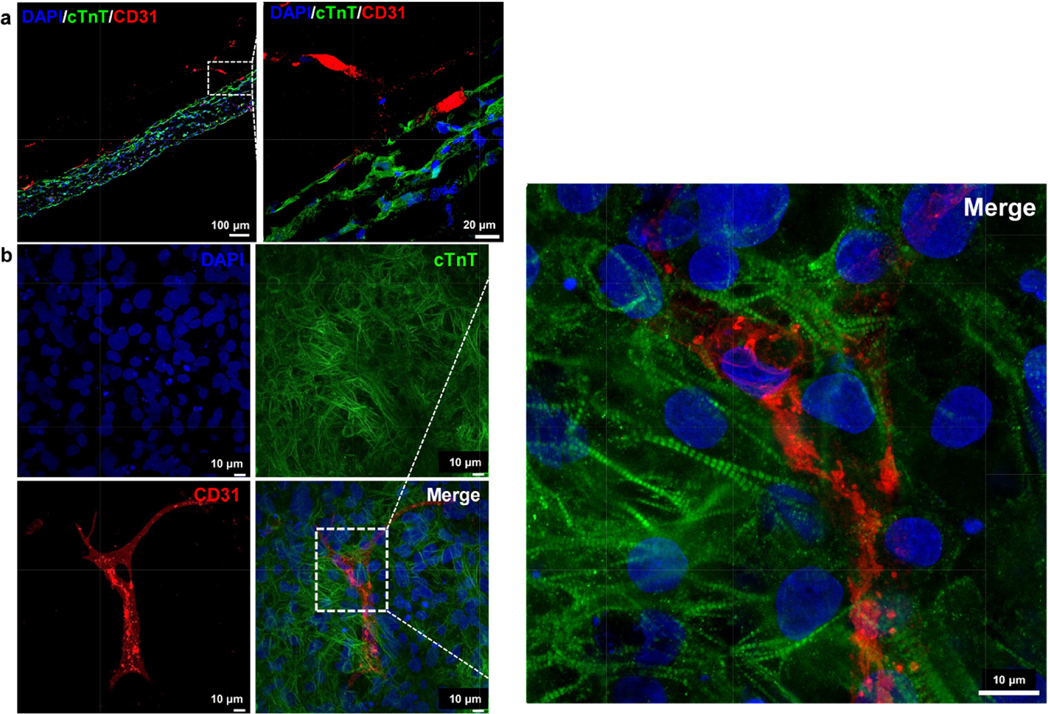
Figure 5.

Fluorescent staining with cTnT and CD31 showing developing vasculature in tissue cultured for (a) 4 weeks, along with (b) whole-mount staining of a 2-week tissue surrogate. Scale bars for the zoomed-in images are 20 μm and 10 μm for (a) and (c) respectively.
