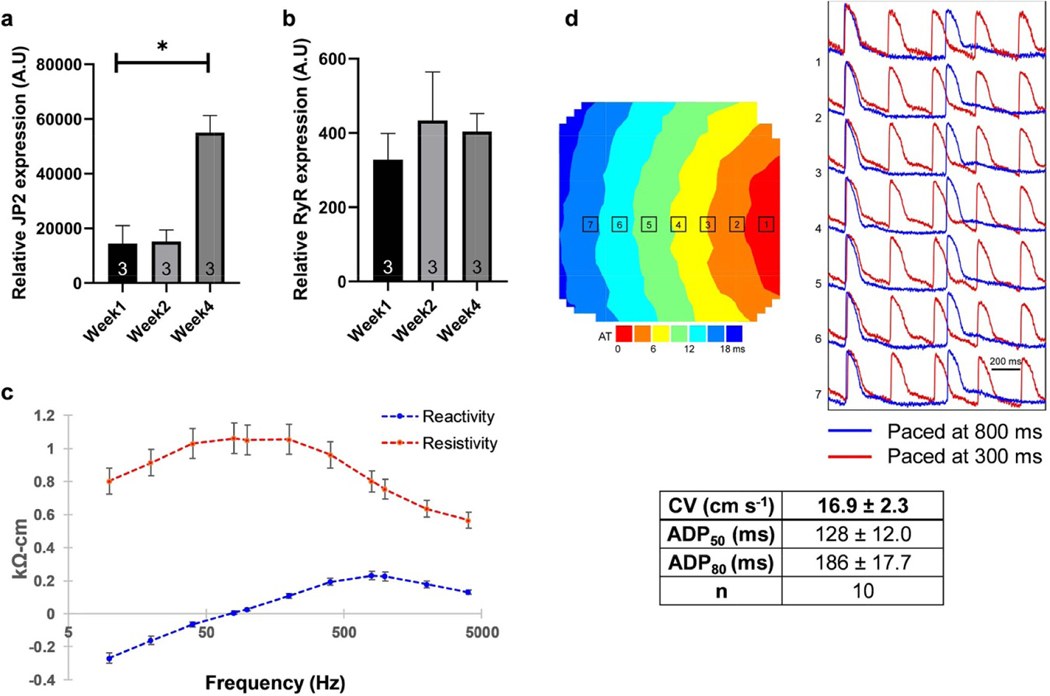
Figure 9.
Expression of (a) JP2 and (b) RyR in the cardiac tissue surrogate structures over the different culture periods, ∗p < 0.05 (n = 3). (c) Tissue reactivity and resistivity shown as a function of stimulation frequency, (n = 15). (d) Summary of tissue optical mapping, with representative signal propagation heatmap as well as pacing at both 300 ms (red) and 800 ms (blue) (n = 10).

