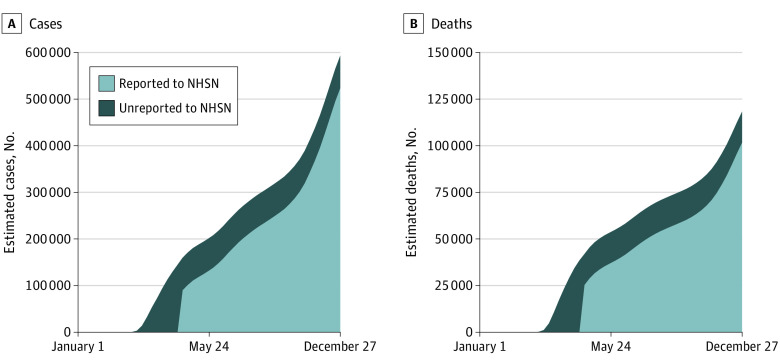
Figure 4. Estimated and Reported National Cumulative Cases and Deaths in Nursing Homes.
The dark blue area shows cumulative cases and deaths using our adjusted measure, which uses the share of nonreporting in sample states to compute an estimate of cumulative cases and deaths before May 24 then uses data from The New York Times13 on population cases and deaths to distribute this estimate across weeks prior to May 24. The light blue area shows cumulative cases and deaths using the National Healthcare Safety Network data.

