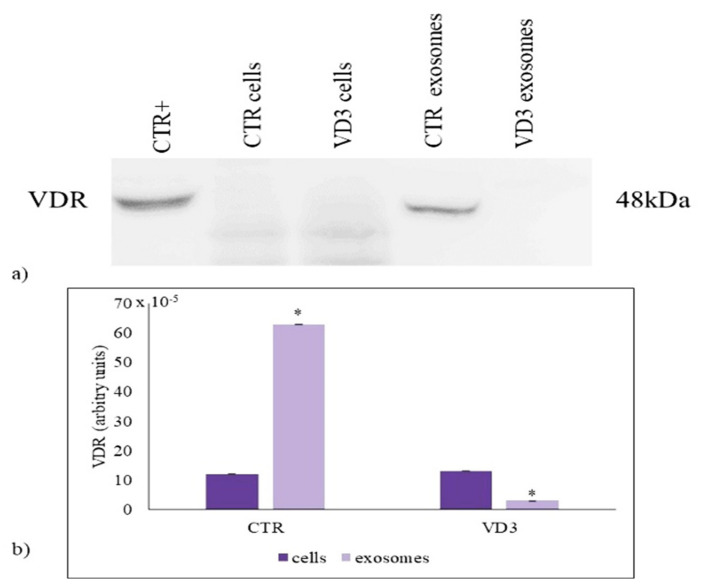
Figure 2.
VDR content in cells and exosomes. (a) Immunoblotting analysis. The position of the 48 kDa was evaluated in relation to the molecular-weight size markers. NCI-N87 cells were used as positive control [17]; (b) The area density was quantified by Chemidoc Imagequant LAS500 by specific IQ programm. Data were expressed as mean ± SD of three independent experiments performed in duplicate (case number: 6). * p < 0.05 versus the control sample. CTR, control sample; VD3, vitamin D3 sample.

