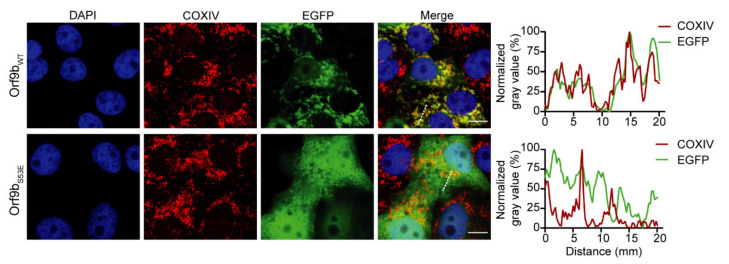
Figure 2.
Subcellular localization of Orf9bWT and Orf9bS53E. Representative immunofluorescence images of Vero E6 cells expressing Orf9bWT-EGFP or Orf9bS53E-EGFP 24 h post-transfection (left panels). Gray value profiles of EGFP (green curves) and COXIV (red curves) (right) were measured with Image J (Fiji) software and normalized to the smallest and largest values in each data set. Gray value profiles were plotted along the white dotted lines. Cell nuclei are shown in blue (DAPI) and mitochondria in red. Scale bars, 10 µm.

