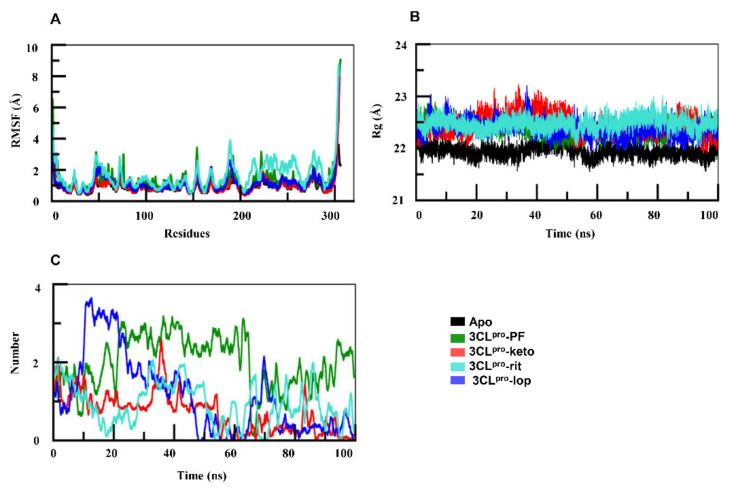
Figure 3.
(A) Root mean square fluctuation graphs of apo-3CLpro and of 3CLpro complexes. In comparison with the apo-form, regions spanning amino acid residues 45–75 and 150–200 in both docked complexes showed deviations. (B) Radius of gyration of the 3CLpro in complexes was higher than that of its apo-form. (C) Number of hydrogen bonds in the four complexes. PF—PF-07321332; keto—α-ketoamide; rit—ritonavir; lop—lopinavir.

