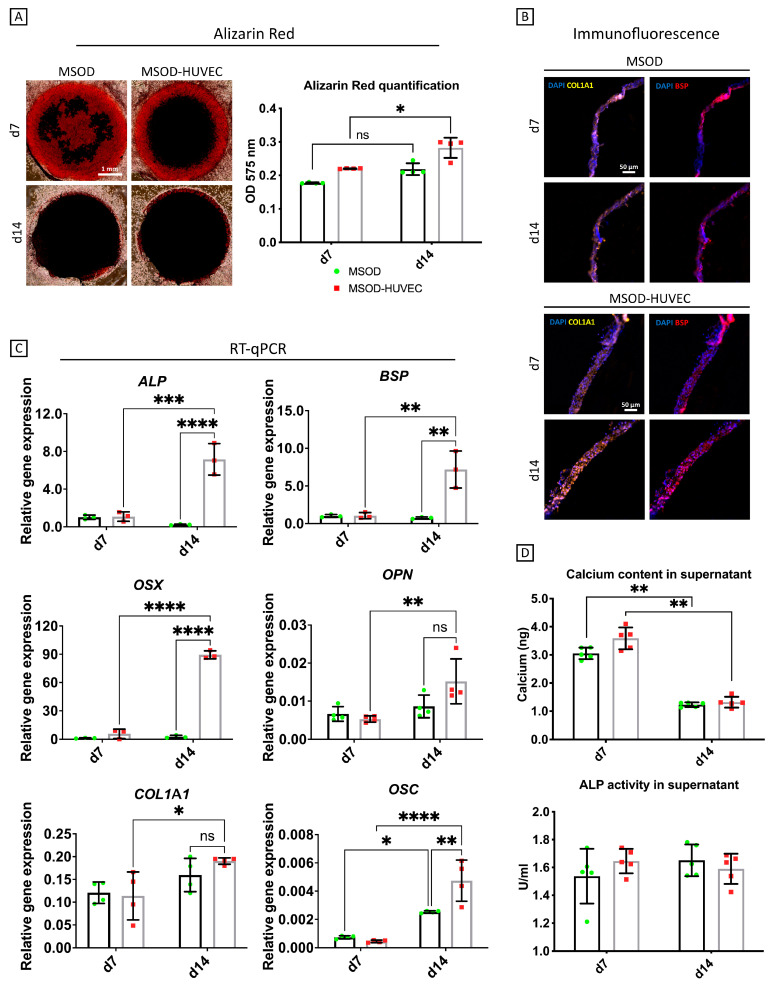
Figure 2.
Osteogenic characterization of the vascularized bone model. (A) Whole mount alizarin red staining imaging and quantification after digestion of the constructs. (B) COL1A1 and BSP immunofluorescence characterization of the cross-section of the constructs. (C) Quantitative RT-qPCR analyses; gene expression is relative to GAPDH levels. ALP = alkaline phosphatase, BSP = bone sialoprotein, OSX = osterix, OPN = osteopontin, COL1A1 = collagen type I, OSC = osteocalcin. (D) Quantitative evaluation of osteogenesis in terms of calcium released in the medium and ALP activity in the culture supernatant. Number of experiments = 3, number of replicates/experiment = 4. ns = non-significant, * = p < 0.05, ** = p < 0.005, *** = p < 0.0005, **** p < 0.00005.

