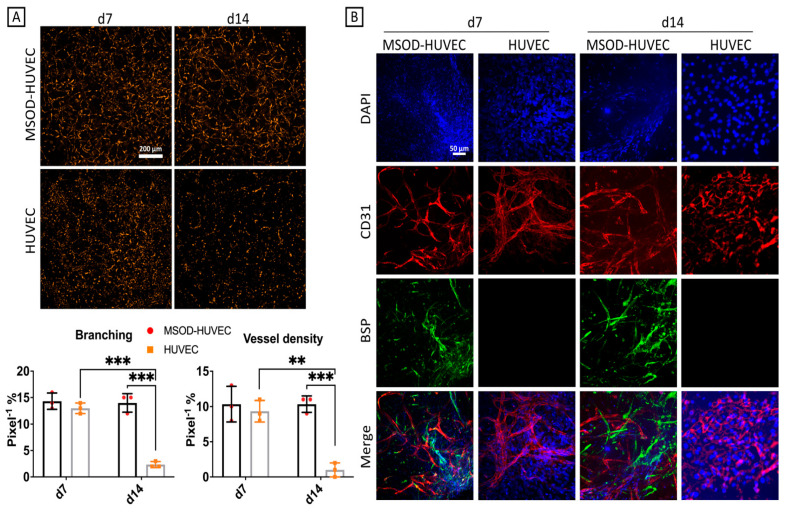
Figure 3.
Tubulogenesis characterization of the vascularized bone model. (A) Live RFP fluorescence imaging and quantification of the RFP-HUVEC network formation alone and in co-culture, showing more tubulogenesis in co-culture with MSOD. (B) Immunofluorescence imaging of CD31 and BSP. Number of experiments = 3, number of replicates = 4. ns = non-significant, ** = p < 0.005, *** = p < 0.0005.

