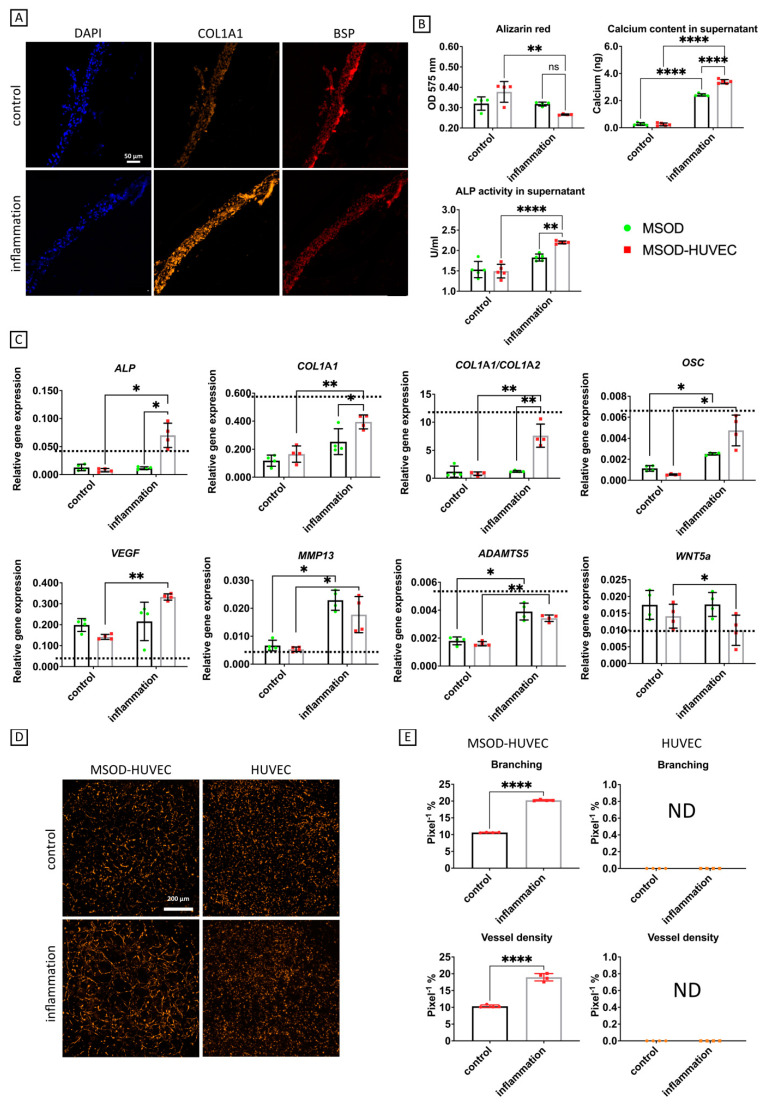
Figure 4.
OA induction through an inflammatory cocktail in the vascularized bone model. (A) Immunofluorescence characterization of COL1A1 and BSP. (B) Biochemical characterizations. (C) Quantitative RT-qPCR analyses; gene expression is relative to GAPDH levels. Dashed lines represent gene expression values of human sclerotic bone isolated from OA patients who underwent total joint arthroplasty (n = 3). ALP = alkaline phosphatase, COL1A1 = collagen type I, OSC = osteocalcin, VEGF = vascular endothelial growth factor, MMP13 = matrix metallopeptidase 13, ADAMTS5 = A disintegrin and metalloproteinase with thrombospondin motifs 5. (D,E) Characterization of network formation by HUVEC in OA induction by imaging and angiogenesis quantification, respectively. Number of experiments = 3, number of replicates/experiment = 5. ns = non-significant, * = p < 0.05, ** = p < 0.005, **** p < 0.00005.

