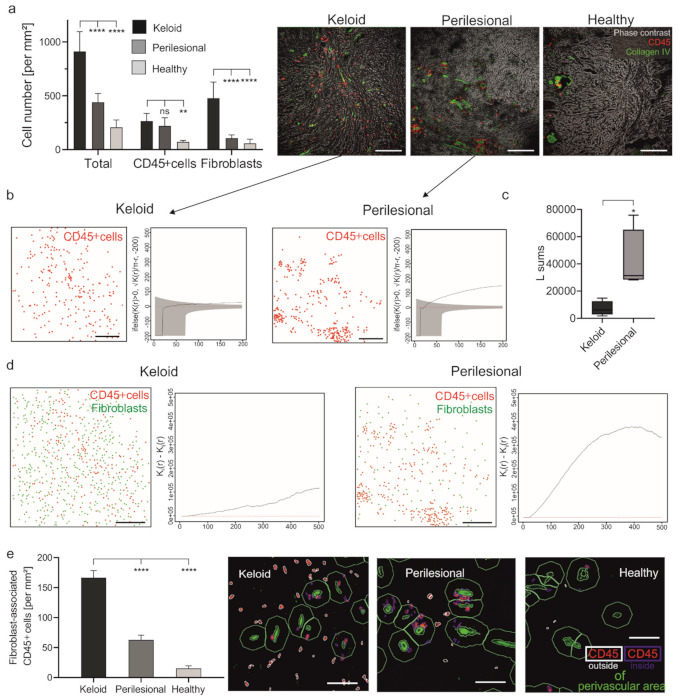
Figure 1.

The increased number of fibroblast-associated leukocytes in keloid. (a) Skin sections of keloid, perilesional and control tissue were subjected to an MAA analysis, and the number of total cells and CD45+ cells were quantified (left panel). Representative images showing an overlay of phase contrast (grey) and CD45+ cells (red) in addition to blood vessels (collagen type IV, green) (right panel). Scale bars = 200 μm; Data are means ± SEM from n patients (n (Keloid) = 8, n (perilesional) = 8, n (control) = 5). Statistical significance was assessed based on the p value (ns p > 0.5, ** p < 0.01, **** p < 0.0001) and determined using, two-way ANOVA and Dunnett’s test. (b) Characterization of the spatial distribution of CD45+ cells (red) across analyzed keloid (n = 4) and perilesional (n = 4) tissue samples. Besag’s L function (solid black line) and acceptance envelope (grey), which give the range of L values for which the cell distribution is not significantly different from complete spatial randomness (red dotted line). For the keloid sample, Besag’s L function is either engulfed in the envelope or hovering just above it, indicating that the cells are mostly randomly dispersed. For the perilesional sample, the Besag’s L function is markedly above the envelope, indicating that the cells are very much clustered. Scale bars = 200 μm. (c) Sum of the Besag’s L functions. n (Keloid) = 4, n (perilesional) = 4, Data are means ± SEM, * p < 0.05. (d) The evaluation of the spatial association of immune cells and fibroblasts. Cell plots showing the distribution of CD45+ cells (red dots) and fibroblasts (green dots) in keloid (n = 4) and perilesional (n = 4) tissue areas and a combination of two Ripley’s K functions (Kii—Kij, for i = CD45 and j = fibroblast) that characterize the spatial segregation of these two cell types. Scale bars = 200 μm. (e) By using the StrataQuest software, a perivascular area was determined by using the collagen type IV staining (green cells) surrounded by a ring (green) with an exterior radius of 20 μm. The number of CD45+ cells outside the perivascular area (defined in the following with the term ‘fibroblast-associated cells’; red cells with ring) were measured. Scale bars = 40 μm; Data are means ± SEM from n patients (n (Keloid) = 8, n (perilesional) = 8, n (control) = 5). **** p < 0.0001, one-way ANOVA and Tukey’s test.
