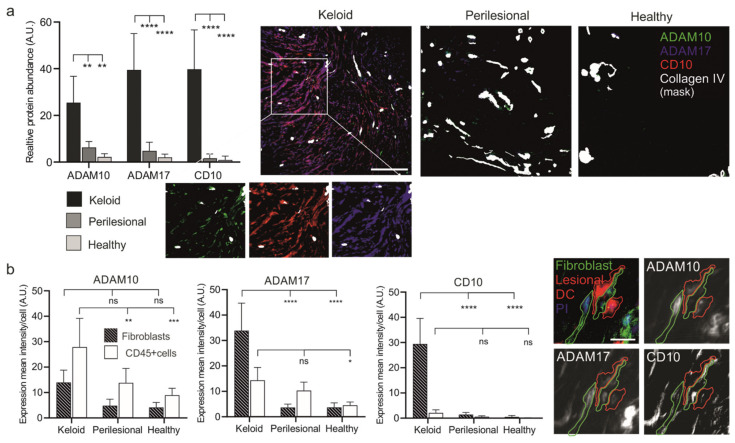
Figure 4.
Increased expression levels of metalloproteases in keloid patients. (a) Tissue sections of keloid, perilesional and control skin were systematically analyzed for metalloproteinase expression by MAA. Quantification of the different metalloproteases (left panel). Relative expression levels of proteases were determined by assessing the grey value intensity. The respective stainings are shown in co-localization images representing an overlay of four markers (ADAM 10, ADAM17, CD10 and a Collagen type IV-mask). Individual close-up images for KD visualize the expression of the proteases. Scale bars = 200 μm. (b) Mean expression levels of ADAM 10, ADAM17 and CD10 in fibroblasts and CD45+ cells. MAA-image gallery showing the expression of analyzed proteases in fibroblasts (green encircled cells) and inflammatory DCs (red encircled cells) in keloid tissue. Fibroblasts were defined by using anti-fibroblast antibody plus CD45 negative signal, and lesional DCs by anti-CD1a, anti-CD11c and anti-CD14 antibodies. Scale bars = 10 μm. Data are means ± SEM from n patients (n (Keloid) = 8, n (perilesional) = 6, n (control) = 5). Statistical significance was assessed based on the p value (ns p > 0.5, * p < 0.05, ** p < 0.01, *** p < 0.001, **** p < 0.0001) and determined using two-way ANOVA and Tukey’s test.

