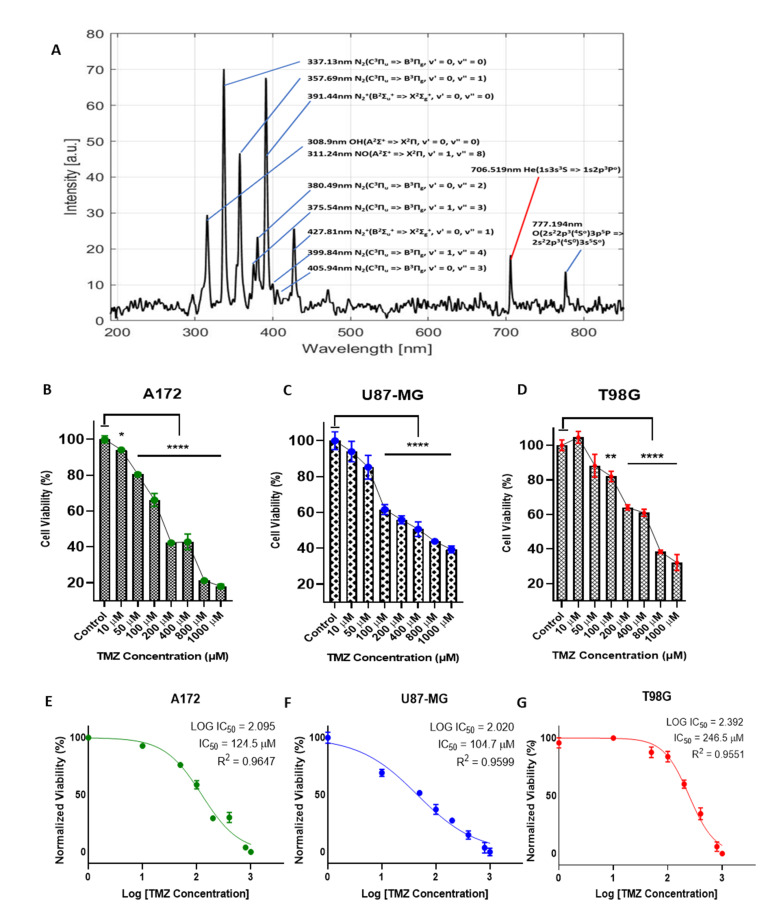
Figure 1.
(A) Optical Emission Spectroscopy of the CAP jet using SpectraWiz® showing most peaks of nitrogen C3Πu => B3Πg ranging from the spectral region of about 300–490 nm. Relative cell viability (%) for the GBM tumor cell line A172 (B), U87-MG (C), and T98G (D) 72 h following a single TMZ treatment. The log IC50 after 5-day TMZ treatment of A172 (E), U87-MG (F), and T98G (G) cell lines. Cell viability measures were collected 96 h after TMZ treatment. All data represent the mean ± SE, and all experiments were performed in quadruplets. Data were analyzed using Student’s t-test * p < 0.05; ** p < 0.01; and **** p < 0.0001, ns—not significant vs. untreated control. n = 16.

