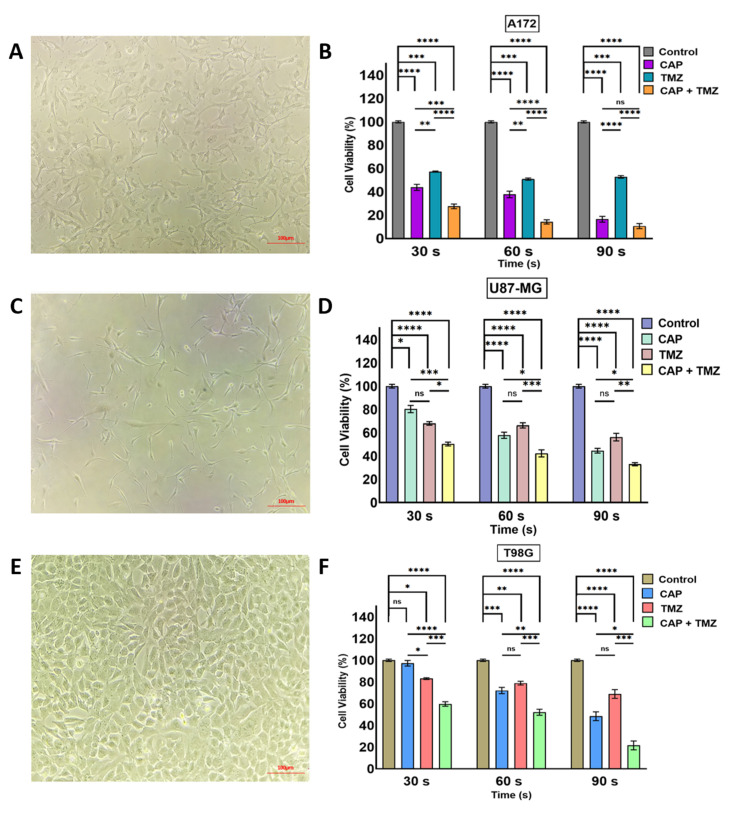
Figure 2.
(A) Bright field image of A172 cells 40–50% confluent at 10× magnification before seeding; (B) relative growth viability for A172 cells after 72 h; (C) bright field image of U87-MG cells 40–50% confluent at 10× magnification; (D) relative cell viability for U87-MG cells after 72 h; (E) bright field image of T98G cells at 80–90% confluency; (F) relative cell viability of T98G cells after 72 h. All of the cell lines were treated with CAP, TMZ, and the co-treatment of CAP + TMZ for 30, 60 and 90 s. The ratios of the treatment groups were normalized for each cell line to their relative untreated controls (0 s). A two-way ANOVA was performed to identify the statistical significance compared to the control and was followed by Dunnett’s multiple comparisons post hoc test. * p < 0.05; ** p < 0.01; *** p < 0.001; and **** p < 0.0001, ns—not significant vs. untreated control. n = 16.

