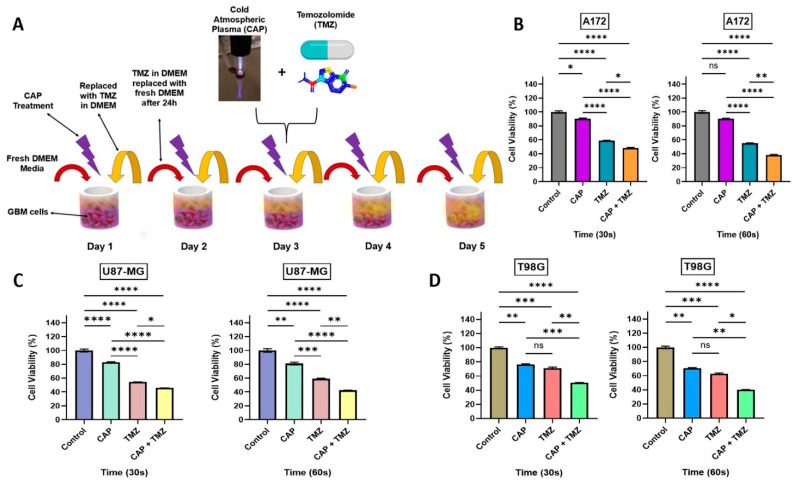
Figure 3.
(A) Schematic representation of the sensitization process; (B) the impact of a 5-day treatment on A172 cells after 72 h, relative viability (%) versus time, 30 s on the left and 60 s on the right; (C) relative cell viability (%) of TMZ-sensitive GBM cells U87-MG to the cytotoxicity of TMZ, treatment for 30 s (left) and 60 s (right); (D) relative cell viability (%) for a TMZ-resistant cell line T98G after 72 h following a 5-day CAP and TMZ treatment. All the cell lines were treated with CAP, TMZ, and the co-treatment of CAP + TMZ for 30 and 60 s, the ratios of treatment groups, were normalized for each cell line to their relative untreated control (0 s) treatment in DMEM. All data represent the mean ± SE. A one-way ANOVA was performed to identify the statistical significance compared to control and was followed by Tukey’s multiple comparisons post hoc test. * p < 0.05; ** p < 0.01; *** p < 0.001; and **** p < 0.0001, ns—not significant vs. untreated control. n = 10.

