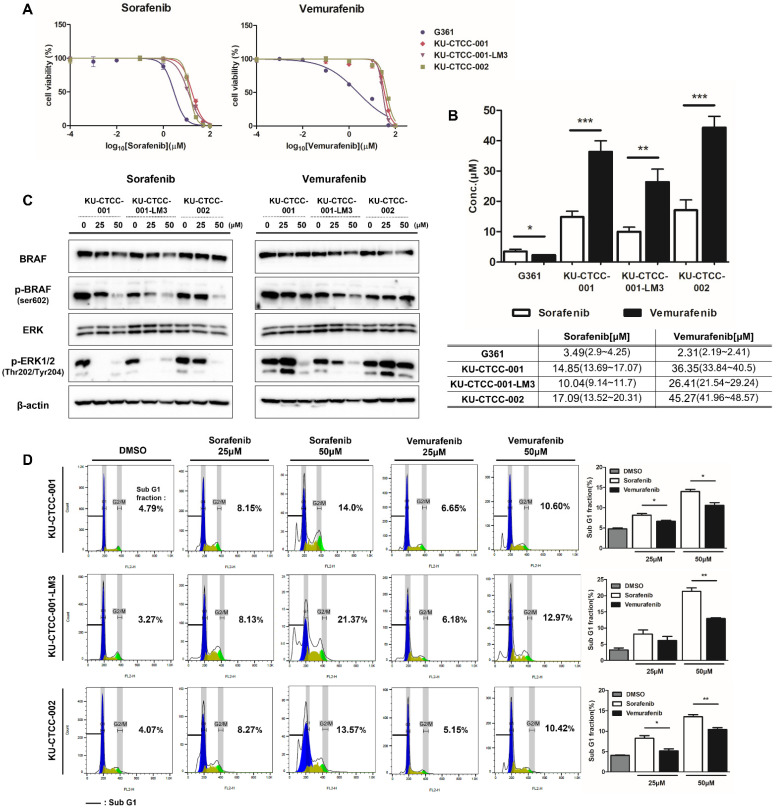
Figure 5.
Drug sensitivity to BRAF inhibitors. (A) Drug response curve to sorafenib and vemurafenib. In contrast to the human cell line G361, sorafenib induced cell death at lower concentrations than vemurafenib in canine TCC cell lines. (B) IC50 values in the cell lines. The IC50 values of sorafenib were lower than those of vemurafenib in canine TCC cell lines. For both drugs, the IC50 value of KU-CTCC-002 was the highest, and that of KU-CTCC-001-LM3 was the lowest. Error bars represent SEM. Statistical significance was determined by unpaired Student’s t-test; * p < 0.05, ** p < 0.01, *** p < 0.001. (C) Comparison of MAPK pathway inhibition between both drugs at the protein level. Sorafenib inhibited phosphorylated BRAF and phosphorylated ERK1/2 protein more effectively than vemurafenib at the same concentration. (D) Evaluation of apoptosis through cell cycle analysis. The degree of apoptosis caused by the drugs was evaluated by calculating the sub-G1 fraction. In the graph, the percentage number represents the sub-G1 fraction. Sorafenib induced more apoptosis than vemurafenib. Error bars represent SEM (n = 3). Statistical significance; * p < 0.05, ** p < 0.01. All experiments were performed in triplicate.

