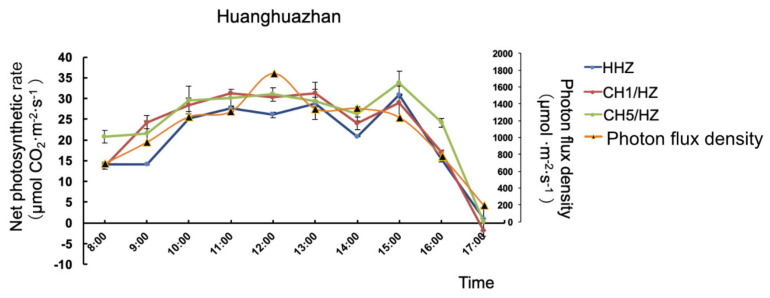
Figure 6.
Diurnal curves of the Pn of HHZ, CH1/HZ, and CH5/HZ plants. Diurnal curves of the Pn of the HHZ, CH1/HZ, and CH5/HZ plants in June in Guangzhou, China (temperature range of 28~36 °C under normal air conditions (CO2 concentration of approximately 400 mmol·mol−1, relative humidity of 50~75%)), were generated. Data shown are the means ± SDs.

