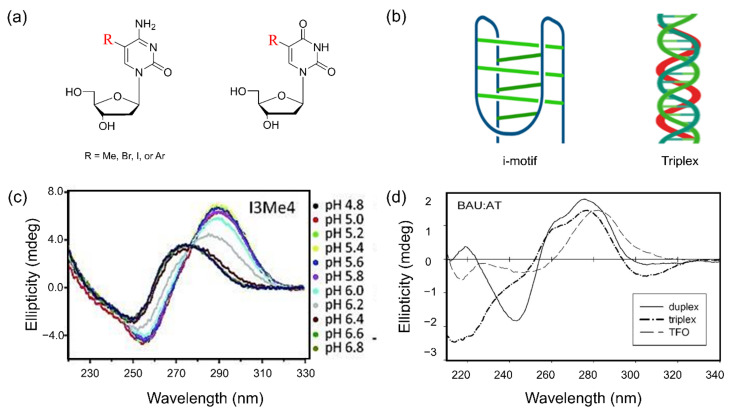
Figure 10.
(a) Graphical representation of modified cytosine and uracil at the C5 position; (b) structures of i-motif and Triplex; (c) CD spectra of i-motif-containing modified cytosine at different pH indicated by different colors, from ref. [203]; (d) comparison of CD spectra between duplex (solid), triplex (dashed dot), and triplex-forming oligonucleotides (TFO, dashed) containing modified sequence at pH 6 from ref. [212]. Copyright (2015) John Wiley and Sons, Inc., and (2004) Oxford University.

