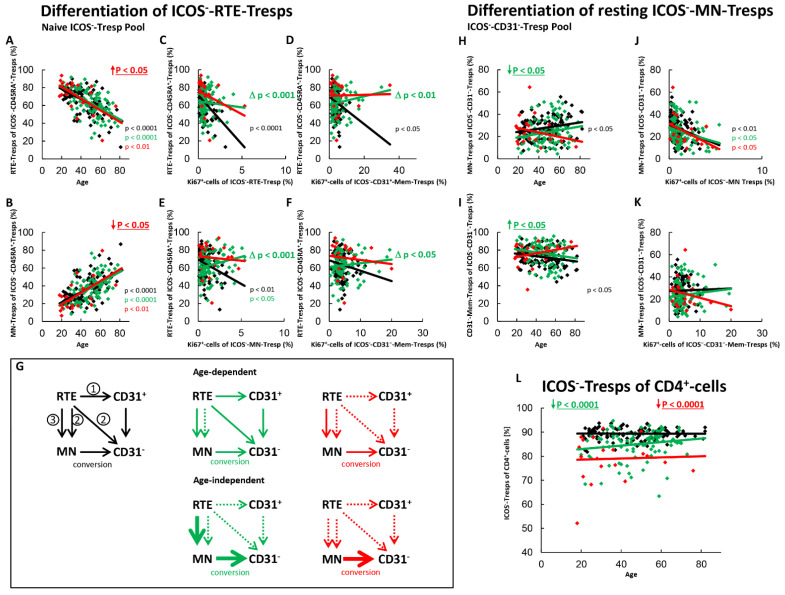
Figure 5.
Differentiation of ICOS−-RTE-Tresps and resting ICOS−-MN-Tresps with age in healthy controls, SLE patients in remission and SLE patients with active disease. The percentages of RTE-Tresps and MN-Tresps within the naïve ICOS−-CD45RA+-Tresp pool (A,B) as well as the percentages of MN-Tresps and CD31−-memory Tresps within the ICOS−-CD31−- Tresp pool (H,I) were estimated depending on age, in healthy volunteers (Black coloured), SLE patients in remission (Green coloured) and SLE patients with active disease (Red coloured). In order to examine the differentiation of ICOS−-RTE-Tresps, the percentage of RTE-Tresps within total naïve CD45RA+-Tresps was correlated with the percentage of Ki67+ cells within total RTE-Tresps (C), CD31+-memory-Tresps (D), MN-Tresps (E) and CD31−-memory-Tresps (F). In order to examine the differentiation of resting MN-Tresp, the percentage of MN-Tresps within total CD31−-Tresps was correlated with the percentage of Ki67+ cells within total MN-Tresps (J) and within total CD31−-memory-Tresps (K). Significant linear regression analyses are marked by black, green, or red P-values. Significant differences in the regression lines between healthy controls and SLE patients in remission or active disease are marked by green or red ∆ p values. Age-independent significant differences between healthy volunteers and study groups are marked by an arrow (↑↓) and their color-matched P-values. The arrow diagrams (G) schematize an increased (thick arrow), consistent (thin arrow) or decreased (dashed arrow) differentiation, color matched for the different patient groups. The double arrow relates to the enrichment of resting MN-cells. The resulting age-dependent and age-independent changes in the percentage of ICOS−-Tresps within total CD4+-T-helper cells are given in (L). Further information of the calculated P-values is illustrated in Table S1.

