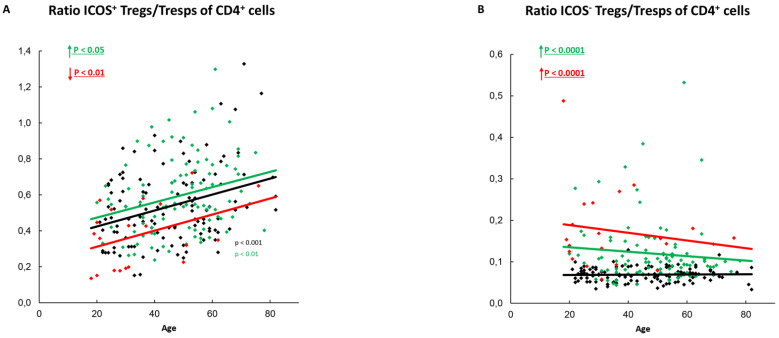
Figure 6.
Ratio of ICOS+-Tregs/Tresps or ICOS−-Tregs/Tresps within total CD4+-T-helper cells. The ratio of ICOS+-Tregs/Tresps (A) as well as the ratio of ICOS−-Tregs/Tresps (B) is shown for healthy controls (Black coulored), SLE patients in remission (Green coloured) and SLE patients with active disease (Red Coloured). The figures present the regression lines concerning the changes with age. Significant age-dependent changes are marked by black, green, or red P-values. Significant age-independent differences between healthy volunteers and SLE patients in remission or SLE patients with active disease are marked by green or red underlined P-values. Further information of the calculated P-values is illustrated in Table S1.

