Figure 2.
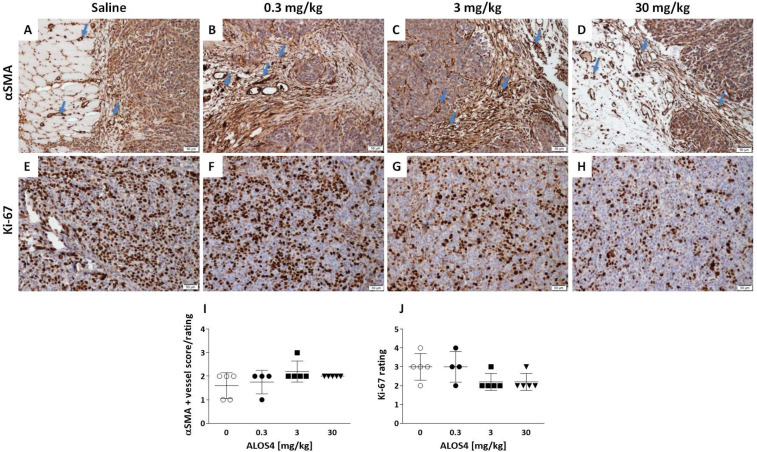
Effect of ALOS4 on carcinogenesis markers presentation in human melanoma A375 SC tumors from nude mice. (A–D) Representative photographs of slides stained for αSMA marker showing the number of blood vessels in the tissue sections (10×). Arrows demonstrate representative vessels in the tumor tissues. Scale: 50 µm. (A) Tumor of a saline-treated mouse shows low to moderate αSMA expression. (B) Tumor of an ALOS4 0.3 mg/kg-treated mouse demonstrates relative moderate vascular density around and within the tumor tissue. (C) Tumor of an ALOS4 3 mg/kg-treated mouse demonstrates relative moderate to high vascular density around and within the tumor tissue. (D) Tumor of an ALOS4 30 mg/kg-treated mouse demonstrates relative moderate vascular density around and within the tumor tissue. (E–H) Representative photographs of slides stained for Ki-67 marker. (E) Tumor of a saline-treated mouse shows a high number of positive cells within the neoplastic cell population. (F) Tumor of an ALOS4 0.3 mg/kg-treated mouse demonstrates a high number of positive cells within the neoplastic cell population. (G) Tumor of an ALOS4 3 mg/kg-treated mouse demonstrates a moderate to low number of positive cells within the neoplastic cell population. (H) Tumor of ALOS4 30 mg/kg-treated mouse demonstrates a moderate to low number of positive cells within the neoplastic cell population. Scale: 50 µm. (I,J) Quantification of histopathological evaluation scoring grades for αSMA (I) and Ki-67 (J) markers.

