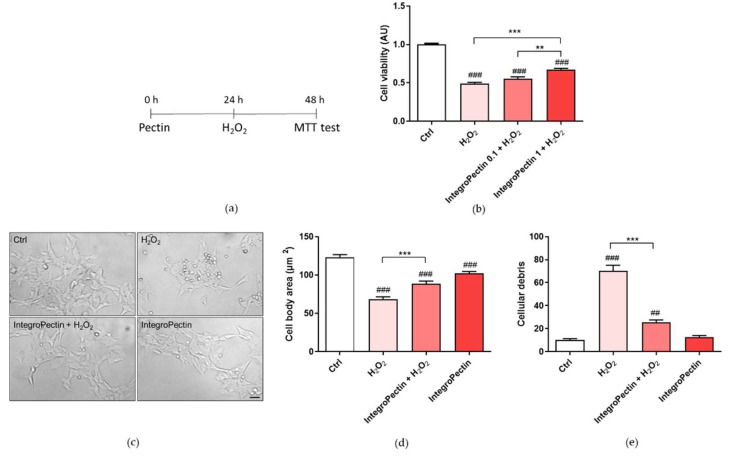
Figure 3.
Effect of grapefruit IntegroPectin on cell viability and morphology of SH-SY5Y cells impaired by H2O2 treatment. (a) Scheme of cell pretreatment with IntegroPectin; (b) Histogram showing cell viability of untreated cells (Ctrl) or treated with IntegroPectin or with H2O2 alone or in combination with IntegroPectin (n = 45); (c) Representative bright field morphological images of untreated cells (Ctrl) or treated with IntegroPectin or with H2O2 alone or in combination with IntegroPectin; (d) Cell body area histogram of untreated cells (Ctrl) or treated with IntegroPectin or with H2O2 alone or in combination with IntegroPectin (n = 68); (e) Amount of cells debris per field histogram of untreated cells (Ctrl) or treated with IntegroPectin or with H2O2 alone or in combination with IntegroPectin (n = 36). Scale bar 50 μm. Tukey test: ## p < 0.01, ### p < 0.001 as compared to control (Ctrl) group; ** p < 0.01, *** p < 0.001.

