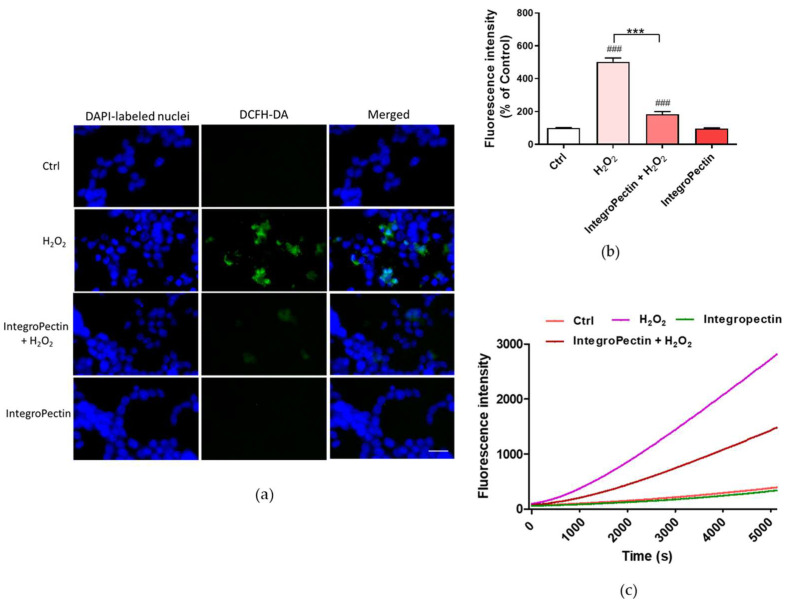
Figure 4.
Effects of IntegroPectin on ROS production driven by exposure to aqueous H2O2. (a) DCFH-DA, DAPI and merged fluorescence microscopy images of untreated cells (Ctrl) or treated with In-tegroPectin or with H2O2 alone or in combination with IntegroPectin; (b) Histogram of fluores-cence intensity of untreated cells (Ctrl) or treated with IntegroPectin or with H2O2 alone or in combination with IntegroPectin measured using DCFH-DA fluorescence assay (n = 26); (c) Oxida-tion kinetics of untreated cells (Ctrl) or treated with IntegroPectin or with H2O2 alone or in com-bination with IntegroPectin, monitored using DCFH-DA fluorescence assay. Scale bar: 50 μm. Tukey test: ### p < 0.001 as compared to control (Ctrl) group, *** p < 0.001.

