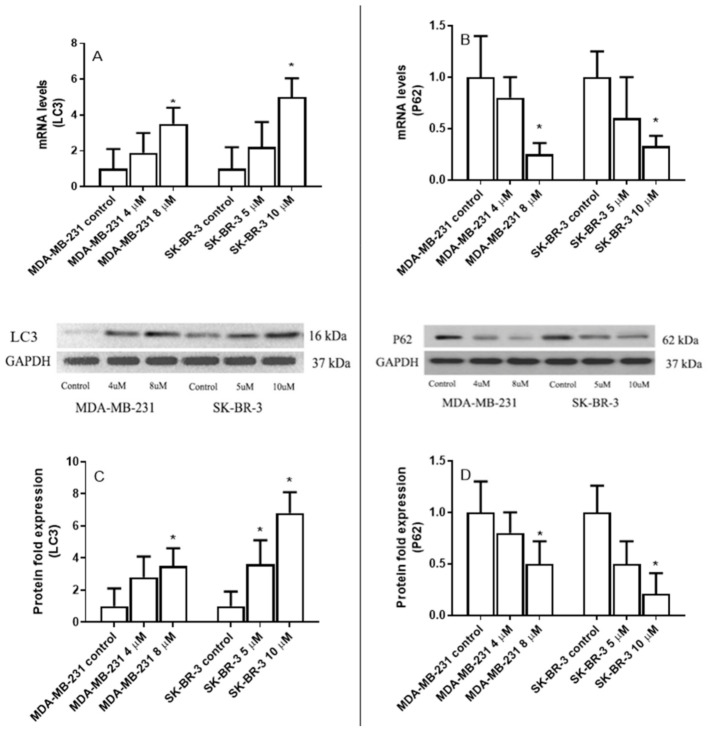
Figure 4.
The effect of eugenol treatment on LC3 and p62 mRNA and protein expression levels. MDA-MB231 and SK-BR-3 cells were treated for 24 h (A,B). Thereafter, LC3 and p62 mRNA expression levels were quantified by RT-PCR. The protein expression levels of LC3 and p62 were then assessed in MDA-MB231 and SK-BR3 cells treated for 24 h with 0, 4, and 8 μM and 0, 5, and 10 μM eugenol, respectively (C,D). * indicates a significant change compared to untreated cells (0 μM) at p < 0.05 based on a one-way ANOVA and the Tukey–Kramer post-ANOVA test.

