Figure 3.
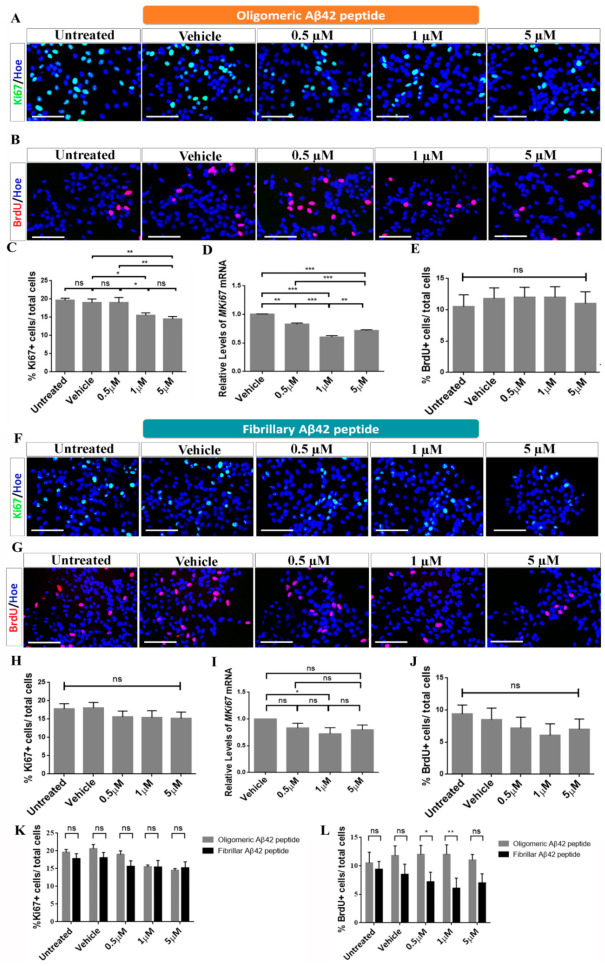
Oligomeric and fibrillary Aβ42 affects cell cycle of differentiating hNS1 cells. (A) Representative images showing Ki67 immunoreactivity (green) after oligomeric Aβ42 treatment. (B) Microphotographs with immunoreactivity for BrdU (red) after oligomeric Aβ42 treatment. (C) Percentage of Ki67+ cells in the different experimental groups after oligomeric Aβ42 treatment. (D) Relative expression levels of MKi67 mRNA determined by qRT-PCR analysis after oligomeric Aβ42 treatment. (E) Percentage of BrdU+ cells in the different cellular groups after oligomeric Aβ42 treatment. (F) Representative images showing Ki67 immunoreactivity (green) after fibrillary Aβ42 treatment. (G) Microphotographs with immunoreactivity for BrdU (red) after fibrillary Aβ42 treatment. (H) Percentage of Ki67+ cells in the different experimental groups after fibrillary Aβ42 treatment. (I) Relative expression levels of MKi67 mRNA determined by qRT-PCR analysis after fibrillary Aβ42 treatment. (J) Percentage of BrdU+ cells in the different cellular groups after fibrillary Aβ42 treatment. (K) Percentage of Ki67+ cells/total cells comparing both added forms. (L) Percentage of BrdU+/total cells comparing both added forms. Nuclei were counterstained in blue with Höechst. Scale bar, 50 µM. Data are represented as means ± SD of at least three different experiments (n = 3). Statistical significance of one-way ANOVA with post hoc Tukey test; * p < 0.05; ** p < 0.01; *** p < 0.001; ns = not significant vs control groups.

