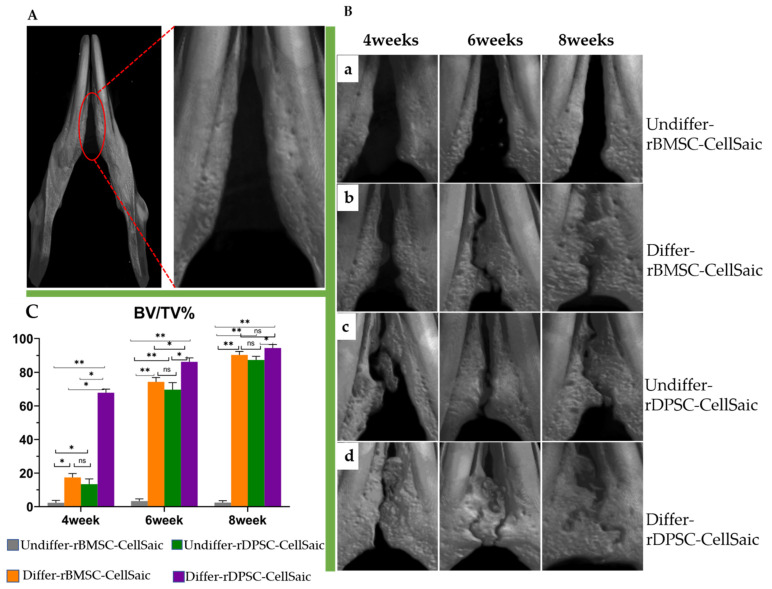
Figure 11.
Osteogenesis after 4, 6, and 8 weeks using microcomputed tomography and analysis of bone volume/tissue volume. (A) Blank control group 4 weeks after the operation. (B) Osteogenesis at 4, 6, and 8 weeks; (a) rBMSC-CellSaic undifferentiated group; (b) rBMSC-CellSaic bone differentiated group; (c) rDPSC-CellSaic undifferentiation group; (d) rDPSC-CellSaic differentiation group. (C) Analysis of bone volume/tissue volume (%). (* p < 0.05, ** p < 0.001, ns: no significance).

