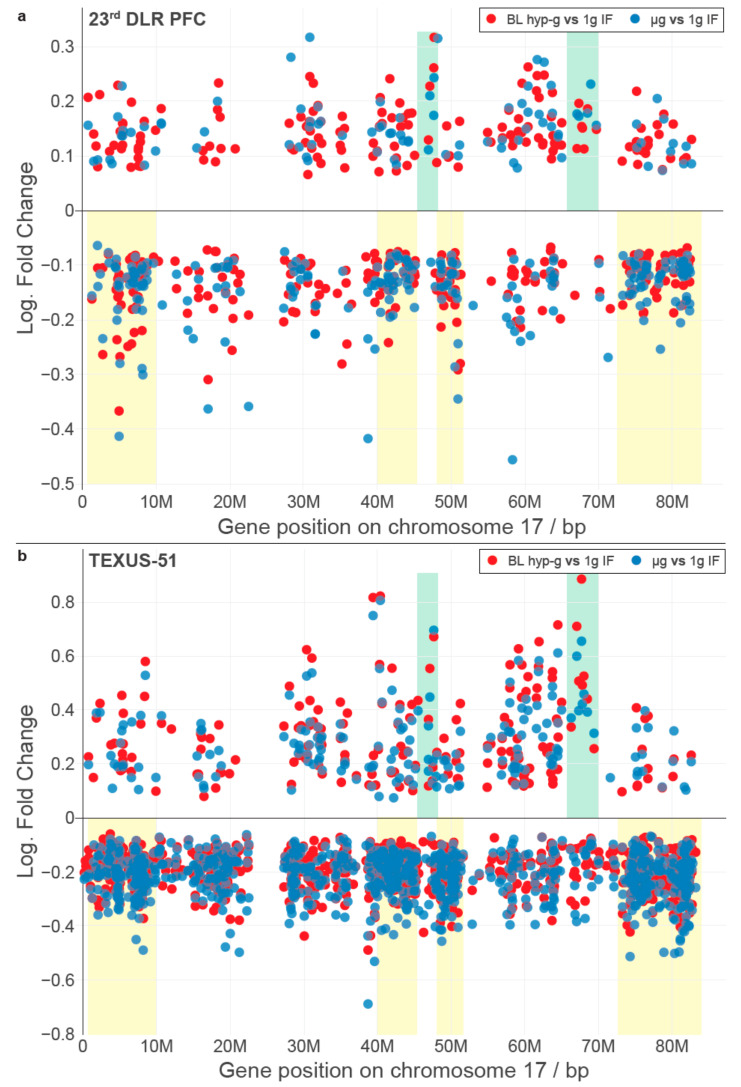
Figure 2.
One-dimensional (1D) projection of significantly differently expressed genes (false discovery rate-adjusted p value < 0.05) along chromosome 17 of the selected altered gravity datasets. Regions that show an accumulation of downregulated genes in all datasets are indicated in yellow, and regions that show strongly upregulated genes with only a few to no downregulated genes in the same cluster are indicated in green. (a) Comparisons for hypergravity and microgravity from the 23rd DLR PFC; (b) comparisons for hypergravity and microgravity from the TEXUS-51 sounding rocket campaign.

