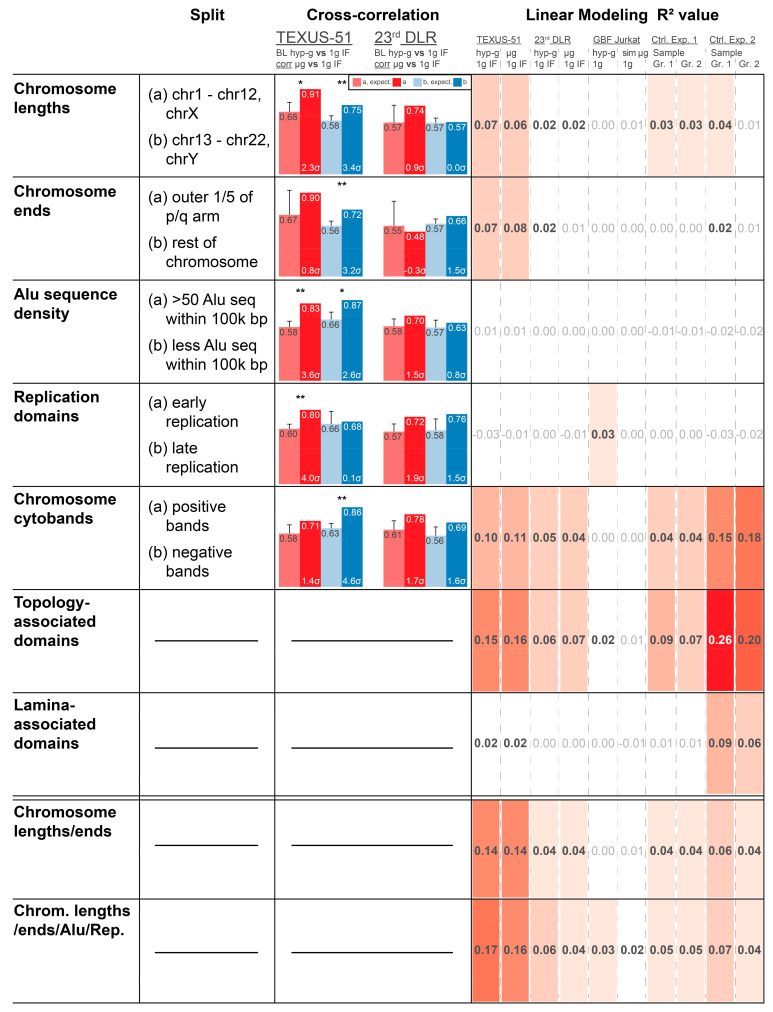
Figure 4.
Model hypothesis testing results on the analysis of different potential underlying DNA structures that could be involved in the observed differential gene expression patterns. Each row represents one structural element, and the last two rows are combinatory models. The first column “split” describes the structural element-based rule by which the top 2000 differentially expressed genes are separated into two groups. For both subsets, a correlation of regional trends analysis was performed independently. The following columns show the results of the correlation of regional trends analysis, the Spearman correlation coefficient for the gravity-related intra-experiment comparisons, TEXUS-51 hyper gravity vs. 1× g inflight (1gIF) compared with microgravity vs. 1gIF and the same comparison for the 23rd DLR PFC experiment. Significantly different samples with inter-experiment correlation coefficients of >2σ are indicated with *, and highly significantly different samples with inter-experiment correlation coefficients of >3σ are indicated with **. A difference in behavior between split sets (a) and (b) indicates an underlying structure in the data represented in those categories. For topology-associated domains, lamina-associated domains, and the mixed models, no categorial split into two categories could be defined that provides enough bins per category to be able to perform this analysis. The column “linear modeling” provides the average R2 predictive strength for the logFC of genes of linear models based on the underlying DNA structures. Fits were performed on all used data groups separately (columns) and performed independently on datasets including the top 2000 genes. Results for the top 5000 genes and all 16,800 uniquely mapping genes can be found in Supplementary Materials. Due to the very rudimentary linear models, no high R2 values are expected. The scale ranges from 1 (perfect predictive strength) over 0 (no predictive strength) and can be arbitrarily lower (prediction worse than the random drawing of predictions). Color coding is from dark red (highest predictive strength for any hypothesis for all experiments per dataset of top n regulated genes) to white (0.01 or below). Topology-associated domains had a high predictive power for control experiment 2 and therefore define the upper limit of the relative color scale.

