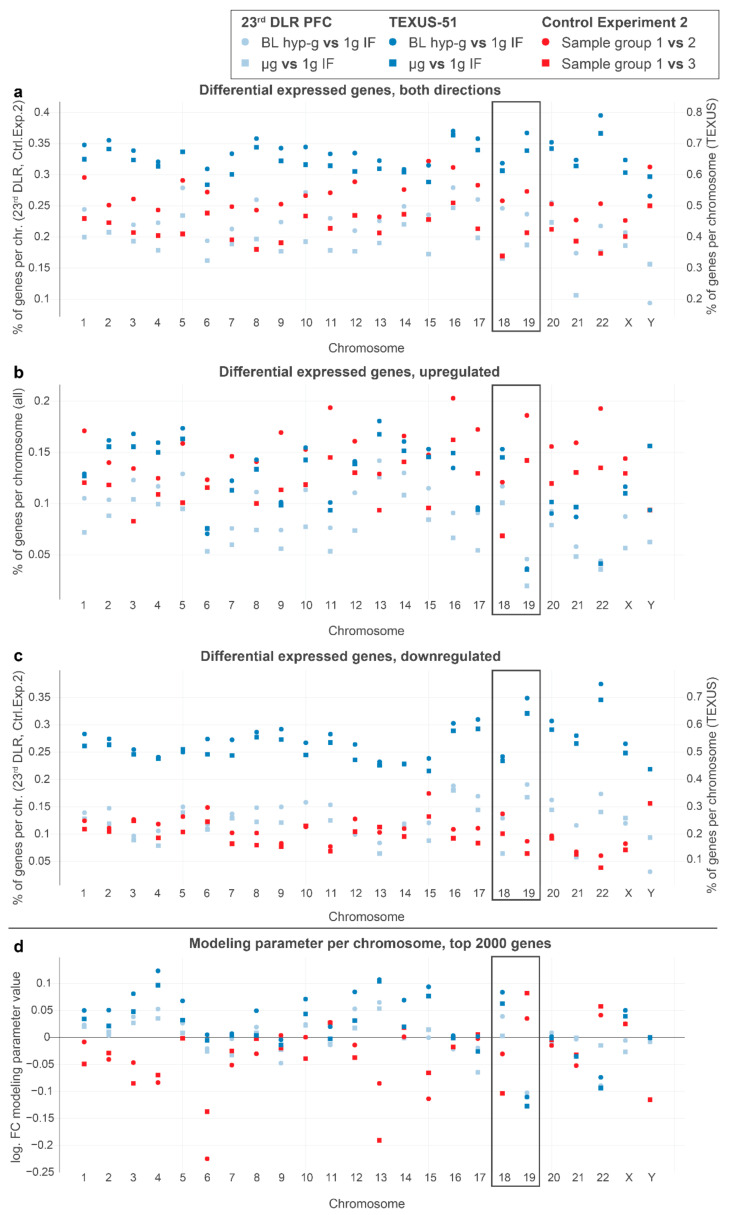
Figure 5.
Pinpointing differential gene expression to single chromosomes. (a–c) The percentage of differentially expressed genes, defined as genes with uncorrected p of <0.05 divided by the number of all measured genes per chromosome for all differentially expressed genes (a), upregulated genes only (b), and downregulated genes only (c). (d) Elastic net modeling parameter (analysis from Figure 3) describing the overall log fold change for the predicted values that is assumed for the entire chromosome in the chromosome length linear model based on the top 2000 genes. Chromosomes 18 and 19 are highlighted as reference points with known geometry for Jurkat cells. Real altered gravity conditions are marked in blue, and control experiment 2 conditions are indicated in red.

