Figure 6.
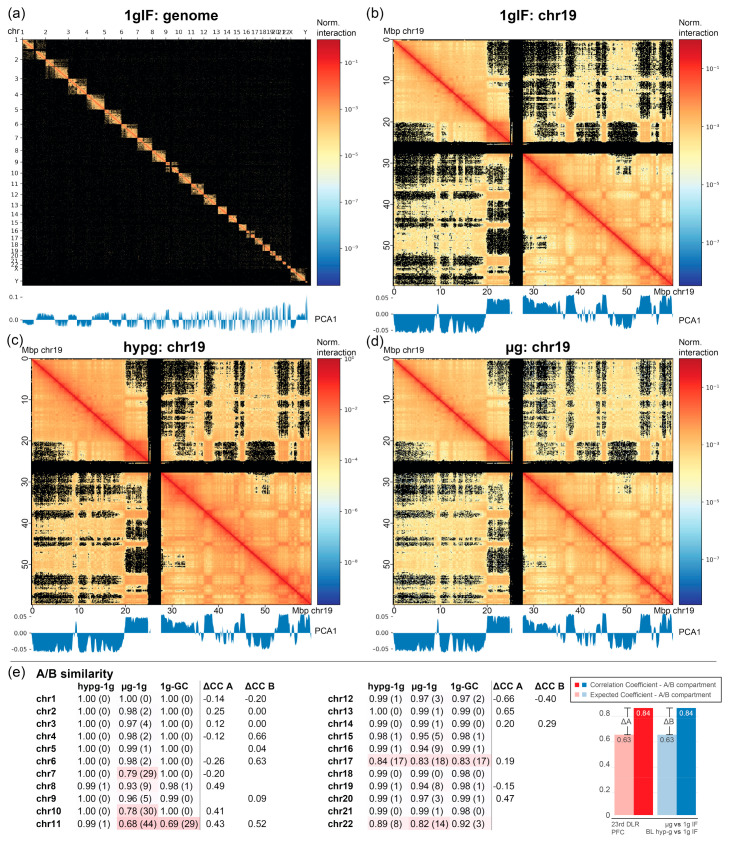
Chromosome conformation capture in altered gravity. (a) Interaction map of the entire human genome of Jurkat human immune cells during the 4th Swiss PFC. Chromosomes and chromosome compartments appear as rectangles. Pearson interaction scores are given. The A/B compartment eigenvector score as a measure of eu-/heterochromatin compartmentalization is given below. (b–d) Interaction map of chromosome 19 and A/B compartmentalization for the three flight phases (i.e., 1× g inflight reference, hypergravity, and microgravity). No larger structural change of A/B compartments could be identified. (e) Quantification of the A/B similarity among different flight conditions. Given is the medium and the first standard deviation of the Pearson correlation coefficient of the A/B calling tracks between the samples of two flight conditions. Hypg-1g represents the in-flight changes between normal gravity and hypergravity, µg-1g represents the effects of microgravity, and 1g-GC indicates the flight vs. ground reference control. Additionally, the differences in actual and expected correlation coefficients for the two 23rd DLR PFC transcriptomics samples are given for the A and B compartment subsets per chromosome if applicable (compare Figure 4 subset testing). The score is explained in the diagram on the right.

