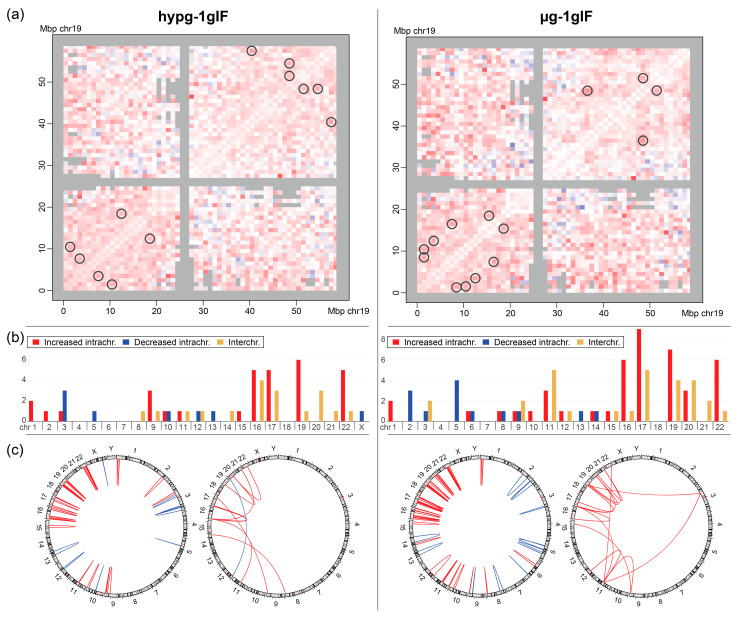
Figure 7.
Differential chromosome conformation captured to analyze the effects of altered gravity. (a) For the comparisons between hypergravity and 1gIF and between microgravity and 1gIF samples, the Hi-C interaction maps were analyzed for significantly different interactions. Here, differential interaction is displayed for chromosome 19. Colors represent log fold changes, independently of signal strength. Bin pairs that show an increased interaction are highlighted in red, and decreased interaction is highlighted in blue. Bin pairs that show the most statistically significant interaction between conditions are circled. (b) Distribution of significantly different bin pairs over all chromosomes. Intrachromosomal bin pairs are stratified by increased and decreased interaction. For interchromosomal gene pairs, both contacts are listed separately; therefore, for one interaction, both chromosomes appear in the plot. Interchromosomal pairs are not split by increased and decreased interactions, since all of them are increased except for one interaction (compare c). (c) Significantly different interactions for intra- (left circus plot) and interchromosomal (right circus plot) interactions. Increased and decreased interaction is color-coded. Intrachromosomal interactions that have bin pairs close to each other on the chromosome strand appear as strong single lines instead of arches.

