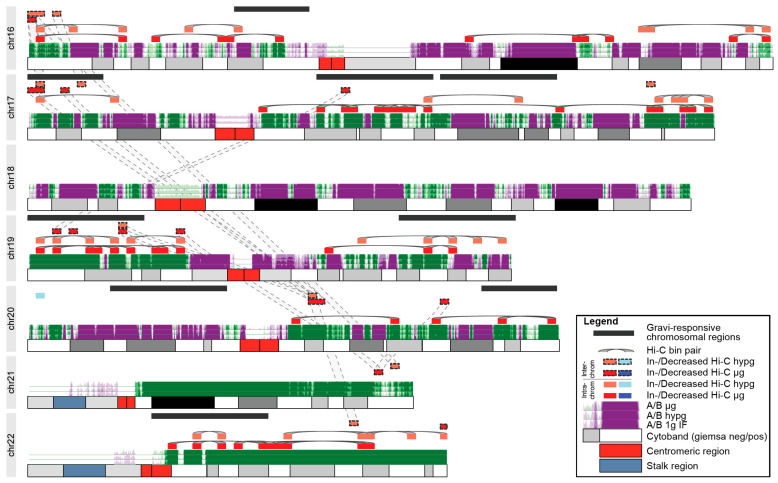
Figure 8.
Overlap between gravity-responsive transcriptional regions from clustering correlation analysis (both 23rd DLR PFC comparisons had a transcriptional binning average for these sites) and significant differential Hi-C bin pairs. Hi-C bin pairs are linked by grey curves. The A/B compartments are highlighted for all three in flight conditions, with 1gIF, hypg, and µg in ascending order. Here, the chromosomes with the majority of differential interaction sites are shown (chr16–22). The full genome is shown in Supplementary Figure S10. The non-randomness of Hi-C bins towards differential transcription clusters over the entire genome was assessed with a Fisher’s exact test as 4.7 × 10⁻⁵ for hypg vs. 1gIF and as 1.3 × 10⁻⁹ for microgravity vs. 1gIF.

