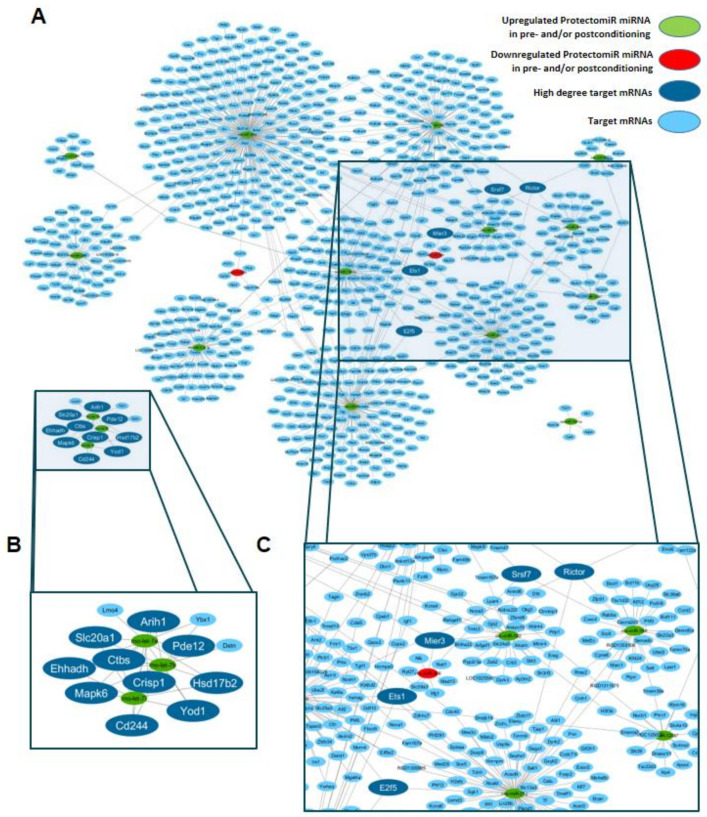
Figure 2.
Predicted interaction network of ProtectomiR microRNAs (A) showing the network neighborhood of predicted hub genes with at least three microRNA–mRNA target interactions (node degree) (B,C). Panel (C) shows the role of the most central target hub Rictor. MicroRNAs upregulated and downregulated in pre- and/or postconditioning and target mRNAs are indicated in green, red and blue, respectively. Dark blue nodes represent mRNAs with a node degree of at least 3. A high-resolution version of the network is available as Supplementary Figure S1.

