Figure 3.
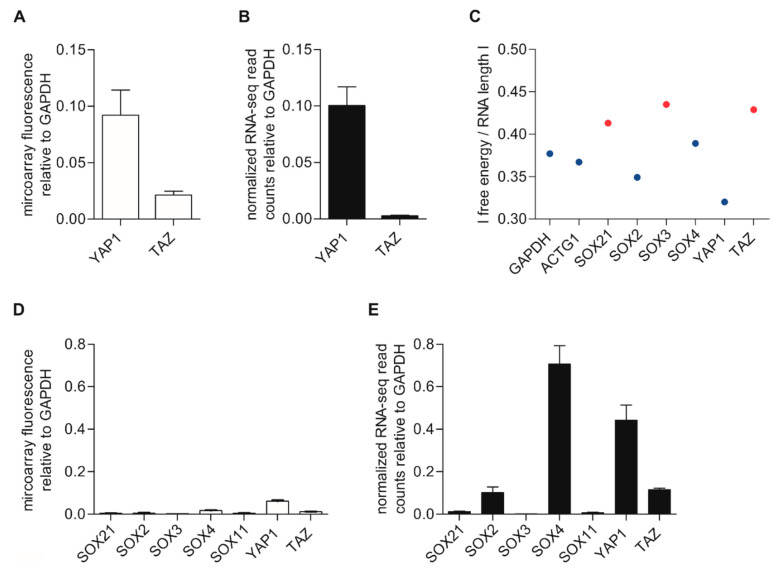
Detection of genes using transcriptome analysis. (A) Analysis of the microarray fluorescence signals of YAP1 and TAZ (Supplementary Table S4) relative to GAPDH within three different cell lines. (B) YAP1 and TAZ detection with RNA-seq (Supplementary Table S5) normalized for each cell line to GAPDH. (C) Trend for genes that are detectable by using RNA-seq (blue dots) as a function of the divided by the RNA length. Undetectable genes via RNA-seq are illustrated as red dots. (D) Analysis of the microarray data from Hoek et al. (GSE4845 GPL570) for some genes of interest. (E) Analysis of RNA-seq datasets of mechanically fragmented RNA samples (SOX3 mean value: 0.88 × 10⁻³) from Kunz et al. (GSE112509). GAPDH was used for normalization. The box plots show the mean ± SEM.

