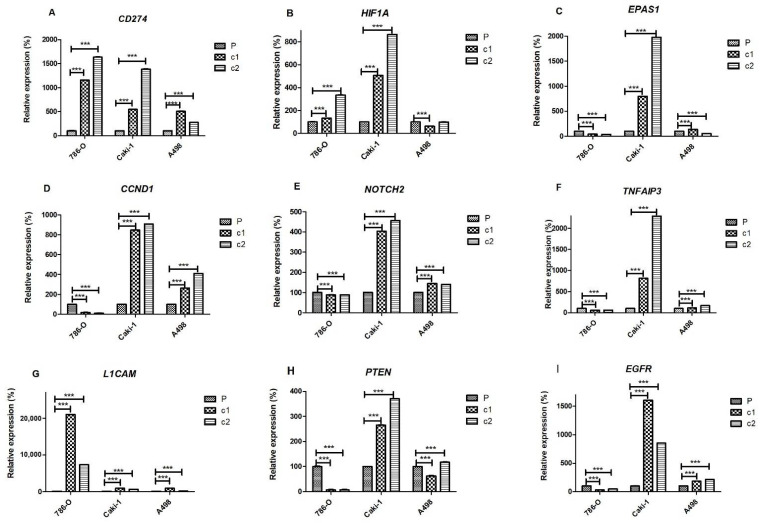
Figure 5.
Gene expression in resistant clones and parental cells of 786-O, Caki-1, and A498 cell lines. Levels of (A) CD274, (B) HIF1A, (C) EPAS1, (D) CCND1, (E) NOTCH2, (F) TNFAIP3, (G) L1CAM, (H) PTEN, and (I) EGFR genes measured by qRT-PCR using GAPDH as the reference gene. Expression levels in resistant clones are depicted relative to their respective parental cells. All experiments were performed in biological and technical replicates. The significance of comparisons is denoted by *** p < 0.001.

