Figure 2.
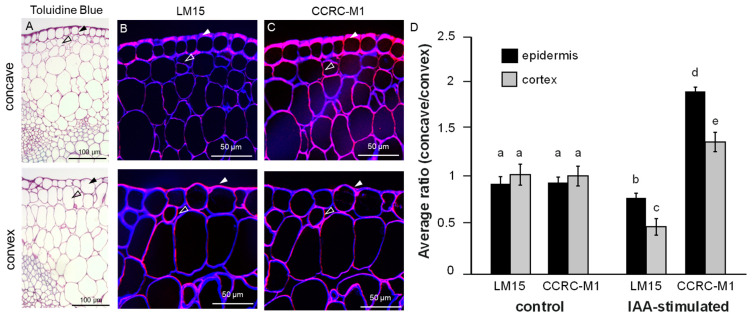
(A–D) In situ spatial distribution XyGs in pea sections. (A) Toluidine staining of the thin resin section through auxin-modulated pea segment. Close up pictures on the tissue morphology of the concave (shorter) and the convex (longer, auxin-modulated). Note the enlargement of the epidermal (closed arrowhead) and cortical cells (open arrowhead) in the convex site. (B–D) Immunolocalization of LM15 (B) and CCRC-M1 (C) epitopes in concave (upper panels) and convex (lower panels) sides of the auxin paste-modulated stem. Images are overlays of the monoclonal antibodies (mAb)-generated signal (red) and the cell wall counterstaining with β-(1,4)-glucan-specific dye Calcofluor White (blue). Note the decrease of CCRC-M1 signal, but significant increase of the LM15 signal in the epidermis and cortex of the convex side. Closed arrowhead: epidermis; open arrowhead: cortex. (D) Quantification of the LM15 and CCRC-M1-generated signal ratios between the concave and convex side of the indole-3-acetic acid (IAA)-stimulated stem. Signals of epidermis and cortex were analyzed separately. Two sides of the control stem (lanolin only) showed no statistically significant differences in LM15 and CCRCM1 labeling (n > 26), One-way ANOVA with Tukey’s post-hoc test with p < 0.05. Error bars represent SEM. Similar letters in the graphs mark no significant statistical difference. Different letters in the graphs mark significant statistical difference with a p-value < 0.05.

