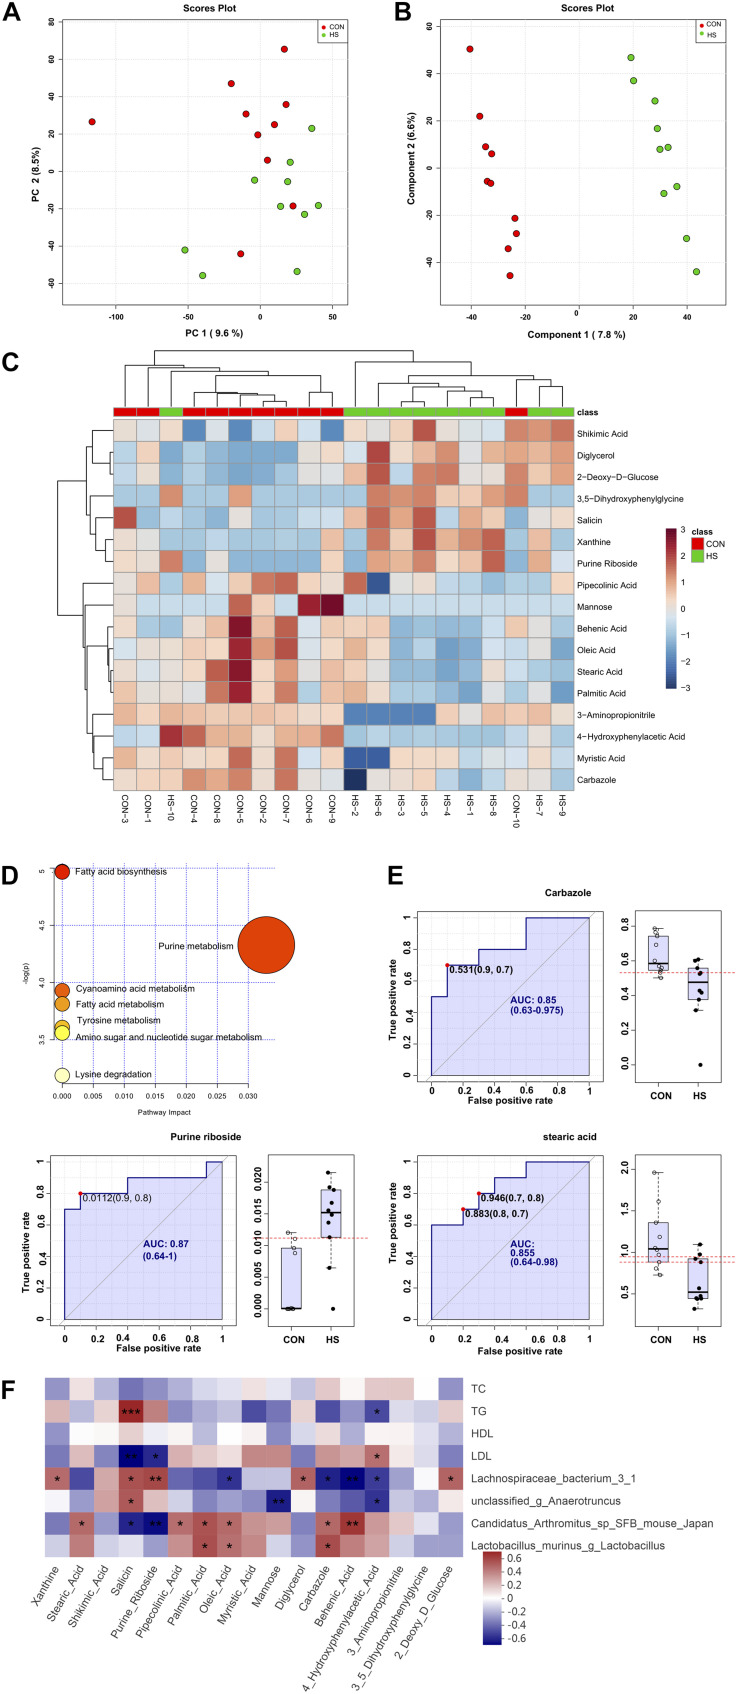
FIGURE 4.
Changes in cecal metabolite profile of mice shaped by heat stress. (A) PCA score plot. (B) OPLS-DA score plot. (C) heatmap tree show metabolites significantly different between groups and their phylogenic relationships. (D) Metabolic pathway enrichment analysis. (E) Biomarker analysis. (F) Correlations between serum indicators and gut microbiota, and cecum metabolic indicators mediated by heat stress. CON, control group; HS, heat stress group; OPLS-DA, Orthogonal partial least squares method-discriminant analysis. *P < 0.05, **P < 0.01, ***P < 0.001.

