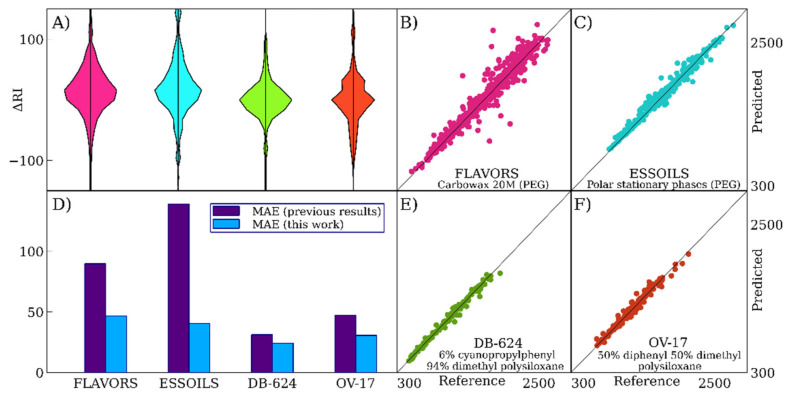
Figure 3.
The accuracy of retention index prediction for various data sets and stationary phases. (A)—distributions of errors for various data sets. (B,C)—predicted versus reference values for FLAVORS and ESSOILS data sets (polar stationary phases). (D)—a comparison with the previously published results [11,24,25,26]. (E,F)—predicted versus reference values for DB-624 and OV-17 data sets (mid-polar stationary phases).

