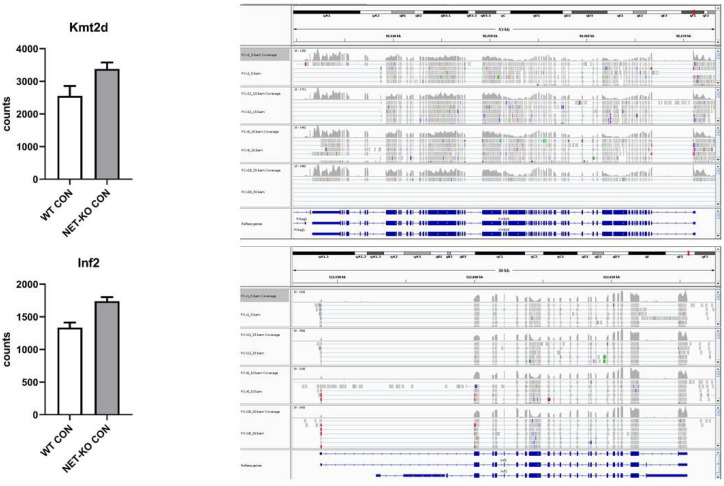
Figure 5.
The expression of selected transcripts that were regulated by mmu-let-7e-5p in the prefrontal cortex of wild-type (WT) and norepinephrine transporter knock-out (NET-KO) mice under the control condition, as shown by NGS analysis. The graphs show the number of RNA-seq reads (Counts) overlapping a given gene. The right panels present the suitable RNA-seq tracks (two samples per group) that were inspected using the IGV viewer. The gene structures and annotations were obtained from the Ensembl database.

