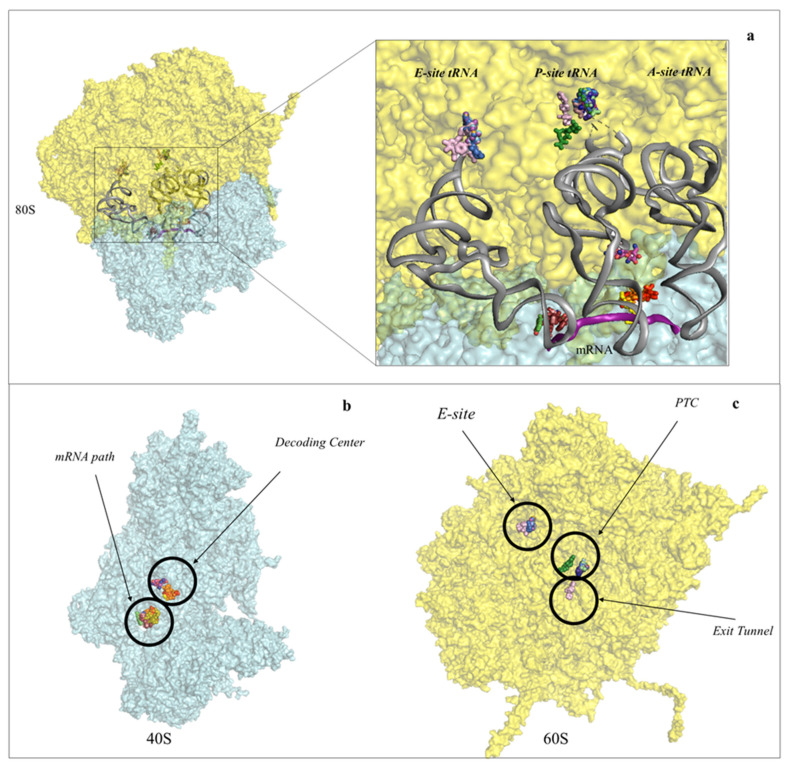
Figure 2.
Protein synthesis inhibitors cluster to ribosomal functional sites. (a) Left-hand side, overview of the eukaryotic 80S ribosome, shown as surface representation. LSU is coloured in cyan, SSU in pale yellow. The three tRNAs and mRNA were modelled in silico after superposition of the Thermus thermophilus elongating complex (PDB: 4V5D) to the yeast vacant 80S model (PDB: 4V88). Right-hand side, zoom-in of the regions where inhibitors bind within the ribosome. For clarity the functional sites are labelled. PTC: peptidyl-transferase centre; PET: peptide exit tunnel; DC: decoding centre; (b) binding of small molecule inhibitors to the eukaryotic SSU. Drugs are represented as spheres, SSU as surface. The functional sites targeted are displayed; (c) binding of small molecule inhibitors to the eukaryotic LSU. Drugs are represented as spheres, SSU as surface.

