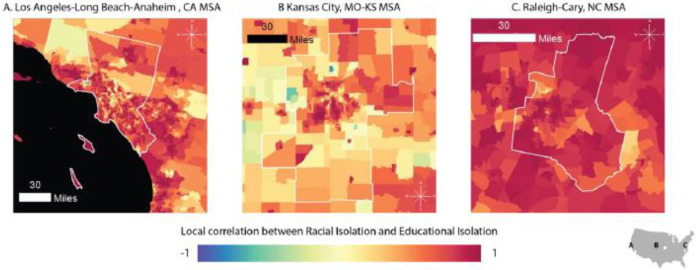
Figure 5.
Census-tract level local correlation between racial isolation and educational isolation in three MSAs: Los Angeles–Long Beach–Anaheim (Panel A); Kansas City (Panel B); and Raleigh–Cary (Panel C). Each MSA is projected to the appropriate projected coordinate system for its location in space, specifically: Panel A: NAD 1983 State Plane California V FIPS 0405 Feet; Panel B: North American Datum (NAD) 1983 Universal Transverse Mercator (UTM) Zone 14N; Panel C: NAD 1983 State Plane North Carolina FIPS 3200 Feet.

