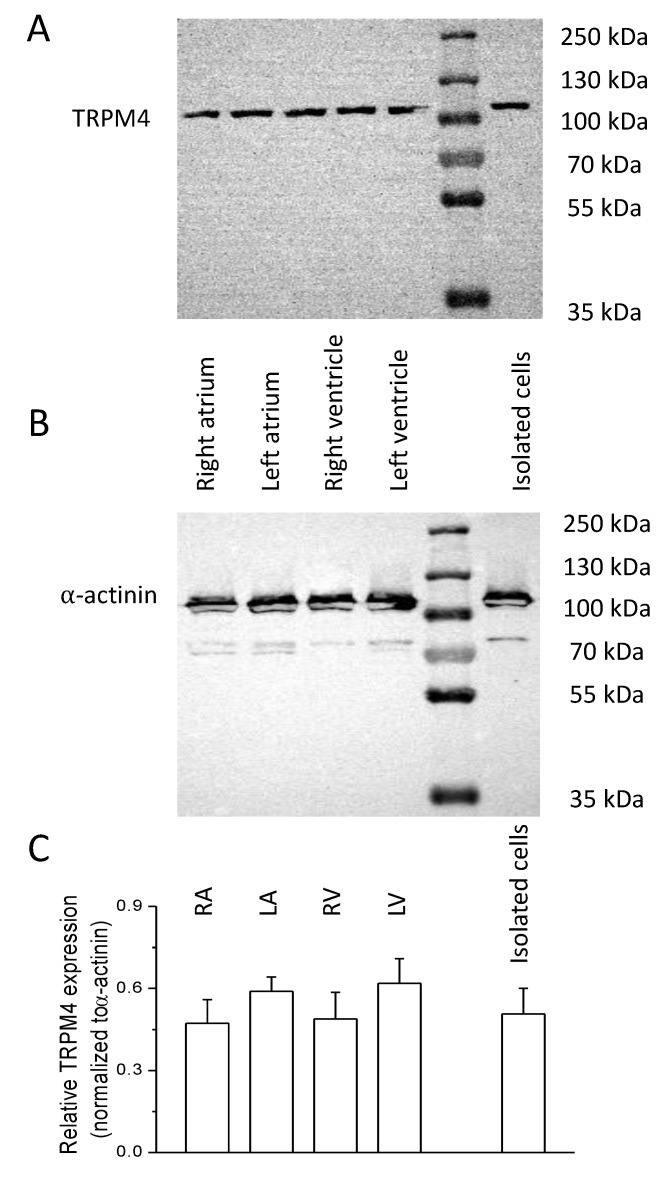
Figure 1.
Cardiac expression of TRPM4 in thecanine heart. A and B: Representative Western blot shows TRPM4 (A) and α-actinin (B) expression in the samples indicated on the picture. The molecular weights on the right refer to the protein ladder visible in lane 5 from the left. (C) Average ± SEM values of relative TRPM4 expression in samples originating from the different cardiac area as indicated on top of each column. The number of animals were five in each case and at least eight independent blots were analyzed.

