Figure 6.
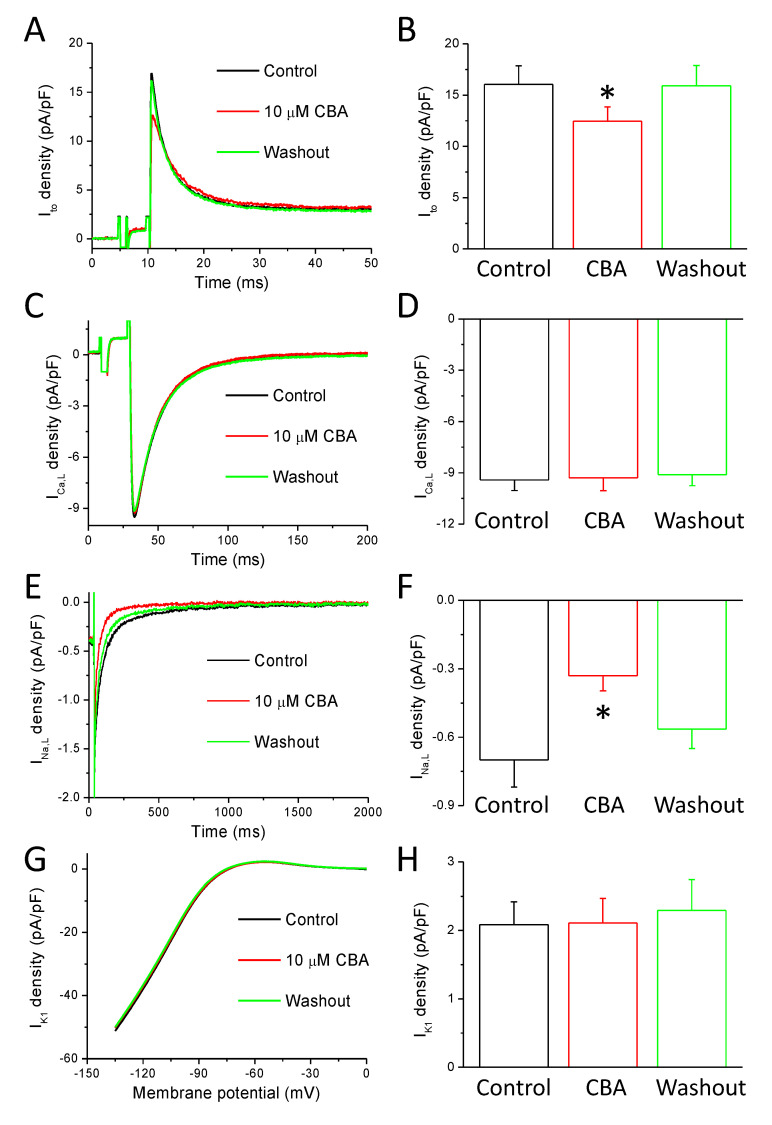
Effects of CBA in ionic currents evoked by conventional voltage-clamp technique. Current traces recorded in control conditions (black), in the presence of CBA (10 µM, red), and after washout of CBA (green). (A) Representative Ito currents. (B) Average ± SEM values of current density values in the indicated conditions of Ito obtained in seven examined cells obtained from five animals. (C) Representative ICa,L currents. (D) Average ± SEM values of current density values in the indicated conditions of ICa,L obtained in eight examined cells obtained from four animals. (E) Representative TTX-sensitive (INa,L) currents. (F) Average ± SEM values of current density values in the indicated conditions of INa,L obtained in nine examined cells obtained from five animals. (G) Representative BaCl2-sensitive (IK1) currents. (H) Average ± SEM values of current density values in the indicated conditions of IK1 obtained in seven examined cells obtained from four animals. Asterisks show statistically significant differences compared to the control.

