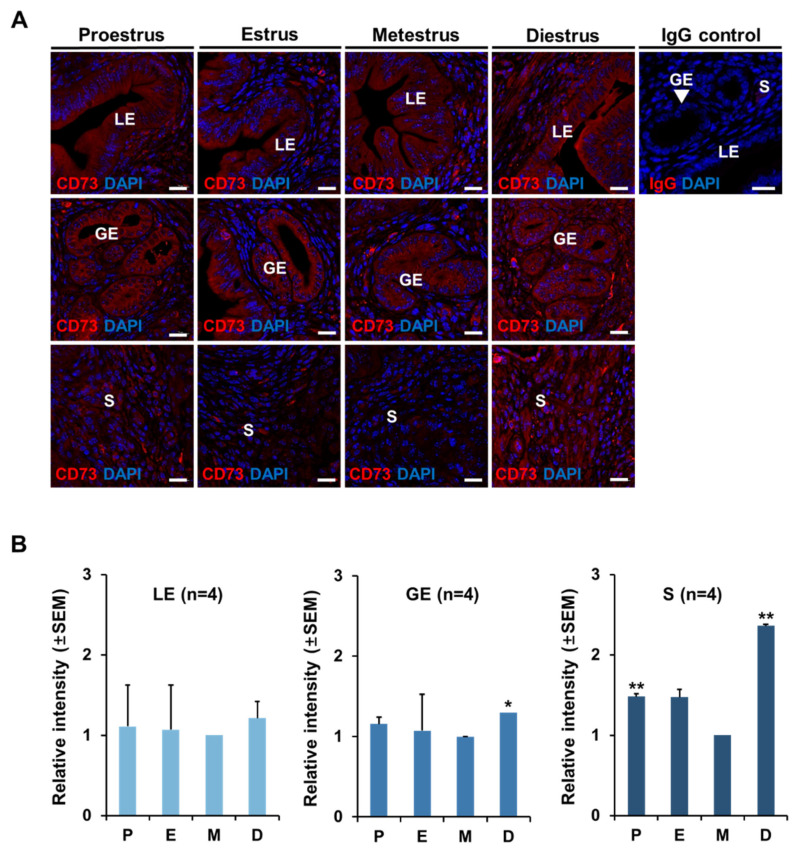
Figure 2.
CD73 localization in mouse uterus at each stage of estrous cycle. (A) Immunofluorescence analysis of CD73 at four stages of estrous cycle (each group n = 4). Blue color represents DAPI in the uterus. Normal rabbit IgG (IgG control) was used as a negative control. LE, luminal epithelium; GE, glandular epithelium; S, stroma. The white scale bars indicate 20 μm. (B) Quantitation of the relative levels of CD73 in mouse uterus during estrous cycle using imaging software Carl Zeiss ZEN 2012 in luminal epithelium (LE), glandular epithelium (GE), and stroma (S), respectively. Each value is expressed as a relative value based on metestrus stage of estrous cycle. Four animals in each group were examined. P, proestrus; E, estrus; M, metestrus; D, diestrus. The one-way ANOVA analysis was used to calculate p-value, * p-value < 0.01, ** p-value < 0.05.

