Figure 5.
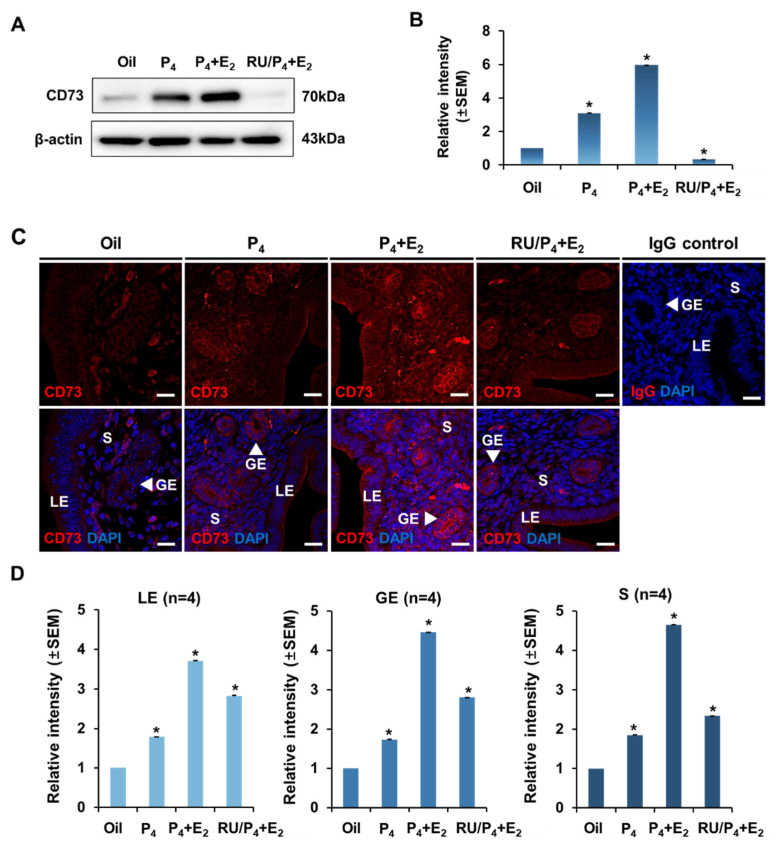
Expression of CD73 during simultaneous treatment of estrogen and progesterone. (A) Western blot analysis showed the expression of CD73 in the uterus of the OVX mouse treated with oil, P4 + E2, or RU486 + P4 + E2 (RU/P4 + E2) (each group n = 4). β-actin was used for an internal control. (B) Relative protein expression of CD73 in the uterus of the OVX mice treated with oil, P4 + E2, or RU486 + P4 + E2 (RU/P4 + E2). The relative expression value was based on the oil treatment value. Data were normalized to β-actin expression and presented as the mean intensity ± SEM. * p-value < 0.01. (C) Confocal microscopic images represent the localization and expression level of CD73 (red) and DAPI (blue) in the uterus of the OVX mice treated with oil, P4 + E2, or RU486+ P4 + E2 (RU/P4 + E2). Normal rabbit IgG (IgG control) was used as a negative control for a secondary antibody. LE, luminal epithelium; GE, glandular epithelium; S, stroma. The white scale bars indicate 20 μm. (D) Quantitative immunofluorescence analysis showed the relative expression of CD73 in the uterus of OVX mice treated with oil, P4 + E2, or RU486+ P4 + E2 (RU/P4 + E2). Relative intensity was analyzed by imaging software Carl Zeiss ZEN 2012 in luminal epithelium (LE), glandular epithelium (GE), and stroma (S), respectively. The relative expression value was based on the oil treatment value. Four animals in each group were examined. Data are shown with mean ± SEM. * p-value < 0.01.

